

CarMax Inc stocks have been trading up by 12.08 percent on strong consumer demand and robust used-car sales growth.
Market Insights For KMX Traders
- Fiscal Q1 revenue hit $8.01B, up 6.2% year over year and ahead of roughly $7.42–$7.43B forecasts, with 3.3% unit growth led by strong wholesale volumes.
- EPS of $1.31 slipped slightly from last year but beat the $0.94–$0.96 range, helped by a 6.8% drop in SG&A per unit despite softer comparable store used-unit sales.
- New CEO Keith Barr rolled out a four-pillar plan focused on sharper pricing, stronger omni/digital experience, richer finance and EPP attachment, and structural cost cuts.
- Stephens upgraded KMX to Overweight with a $66 target after results, while several other brokers lifted targets and framed CarMax Inc as early in a turnaround.
- Some firms, including Barclays and Truist, remain cautious, warning that margin pressure, negative comps, and right-sizing could cap growth into fiscal 2027.
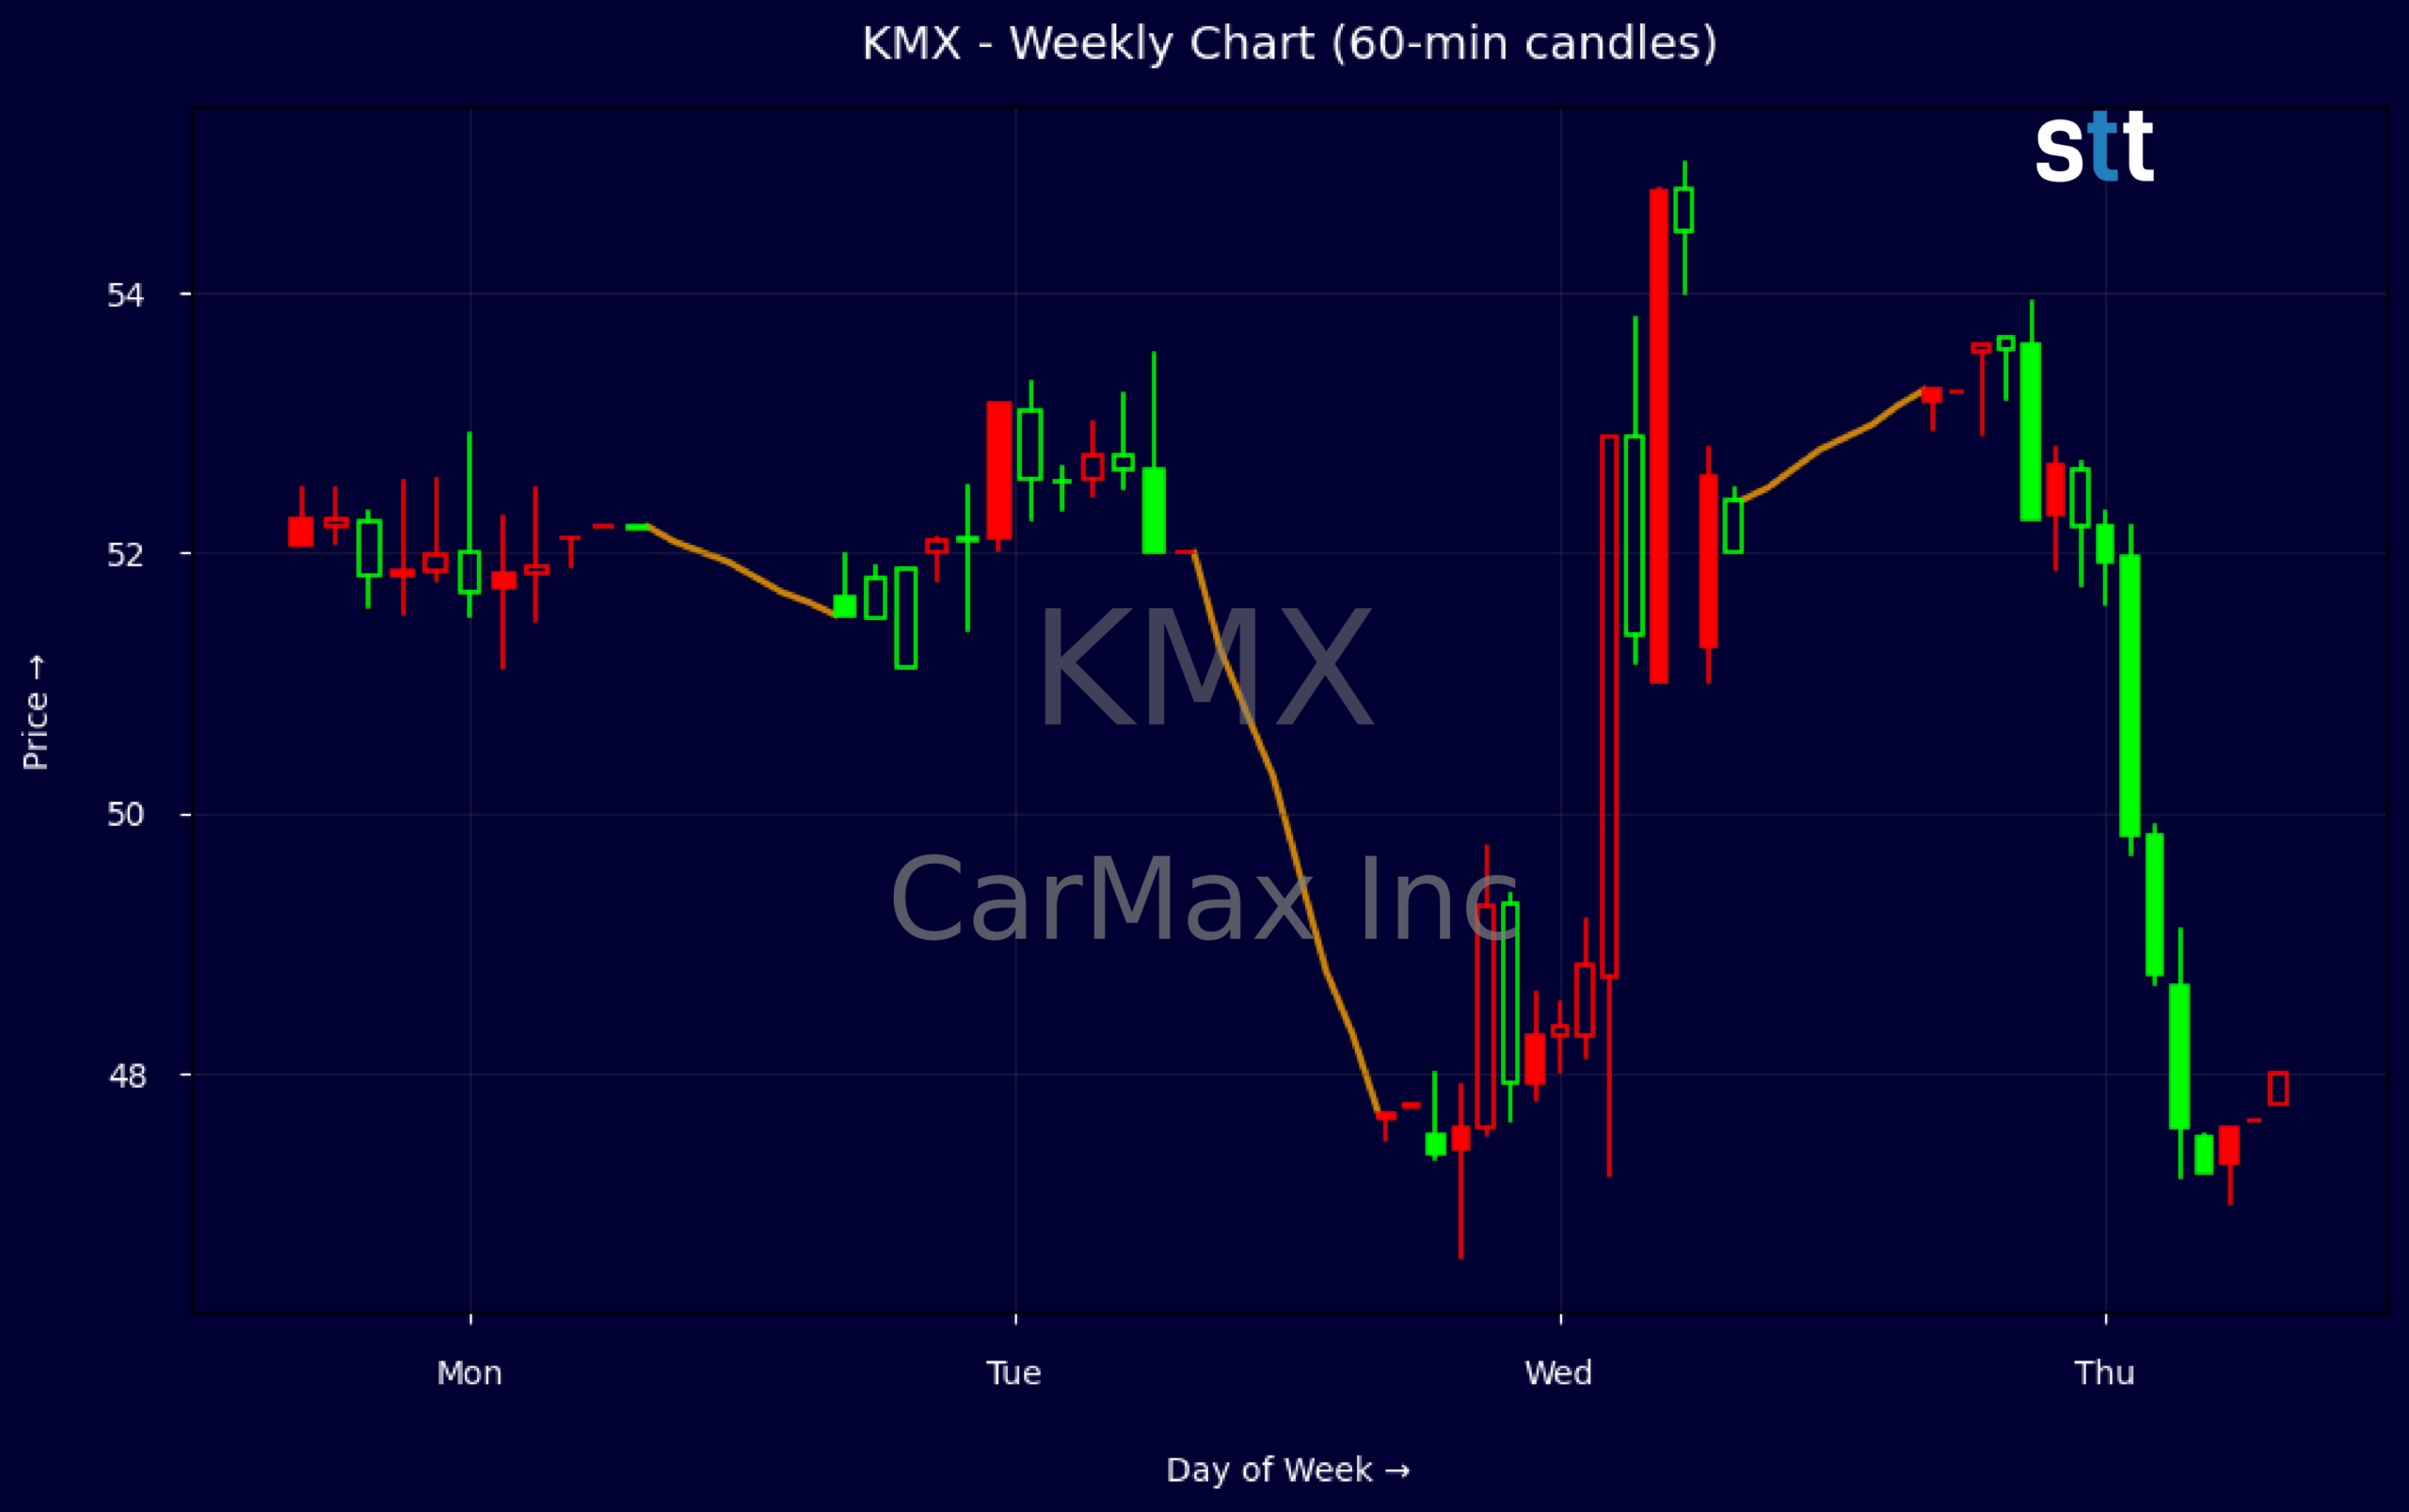
Weekly Update Jun 15 – Jun 19, 2026: On Saturday, June 20, 2026 CarMax Inc stock [NYSE: KMX] is trending up by 12.08%! Discover the key drivers behind this movement as well as our expert analysis in the detailed breakdown below.
Consumer Discretionary industry expert:
Analyst sentiment – positive
CarMax remains the scaled leader in U.S. used vehicles with ~$25.9B revenue but is operating well below potential returns. Margins are thin (gross margin 10.8%, EBIT margin ~1.1%, pretax margin 2.7%), and LTM ROE of ~4% and ROA below 1% are subpar versus Consumer Discretionary peers. Recent quarter shows negative free cash flow (-$687M) and heavy working-capital drag from inventory, but balance sheet leverage is moderate (debt/equity 0.47, current ratio 2.2) and valuation undemanding at ~0.22x sales and ~0.95x book.
Technically, KMX is transitioning from a corrective phase to an emerging uptrend. The sharp drop to $47.35 on 6/17, followed by a strong rebound and close at $53.16 on 6/18, suggests an aggressive buy-the-dip response around the high-40s, likely on elevated volume tied to the earnings/upgrade news. On the weekly tape, $47–48 has now become the key short-term support; actionable level: buy against $48 with a stop below $46, targeting a move back into the high-50s.
More Breaking News
- No Analysis Provided
- Snap Stock Slides As Traders Weigh Ads, Regulation, Insider Sale
- AVGO Stock Holds High Ground As Broadcom Cash Machine Powers On
- CMCSA Rises As Comcast Beats Earnings And Expands Broadband Footprint
Fundamentally, Q1 FY27 showed 6.2% revenue growth and an EPS beat ($1.31 vs $0.94), validating CEO Keith Barr’s early pricing and cost actions, while Street upgrades (targets $55–66) signal growing confidence in a margin-recovery story. Versus broader Consumer Discretionary and Vehicles benchmarks, KMX offers stronger unit growth but weaker profitability today, with higher cyclical risk. I see fair upside to $60–65 over 12–18 months, with strong support near $48 and initial resistance around $55–57.
Quick Financial Overview
CarMax Inc delivered a cleaner top-line story than bottom-line. Revenue over the last twelve months sits around $25.9B, and fiscal Q1 revenue of $8.01B grew 6.2% year over year, beating expectations. Unit volumes climbed 3.3%, driven by wholesale strength, while management deliberately cut prices to regain retail competitiveness. That choice supported sales but weighed on per-unit margins, keeping the profit picture constrained.
Profitability metrics back up that pressure. Gross margin of 10.8% is thin for a retailer, and profit margin under 1% shows limited room for error. The P/E near 23.4 against a price-to-sales of 0.22 and price-to-book around 0.95 says the market pays up for earnings but still values CarMax Inc close to its balance sheet. Returns on equity near 4–10% and modest debt-to-equity of 0.47, plus a current ratio of 2.2, point to an acceptable but not amazing financial backbone.
On the tape, KMX has been active around the earnings and upgrade window. After a drop toward the high $47 area, the stock ripped intraday from roughly $48 to above $53, closing near the top of that range on heavy five-minute volatility. Weekly data show a shakeout low near $47.35 followed by a strong push and close just above $53, a classic earnings-gap-and-go pattern. For short-term traders, that makes the $47–$48 area a key reference support zone and the $53–$54 band an immediate resistance and sentiment gauge.
Conclusion
This is stock news, not investment advice. StocksToTrade News delivers real-time stock market updates tailored to highlight the key catalysts driving short-term price movements. Our coverage is designed for active traders and investors who thrive in fast-moving markets, with a focus on volatile sectors like penny stocks, AI stocks, Robinhood stocks and other momentum plays. From earnings reports and FDA approvals to mergers, new contracts, and unusual trading volume, we break down the events that can spark significant price action.
Looking to level up your trading game? Explore StocksToTrade, the ultimate platform for traders. With powerful tools designed for swing and day trading, integrated news scanning, and even social media monitoring, StocksToTrade keeps you one step ahead.
Check out our quick startup guide for new traders!
- How to Read Stock Charts: A Guide for Beginners
- Trading Plan: 6 Steps to Create One
- How To Create a Stock Watchlist
Ready to build your watchlists? Check out these curated lists:
Once your watchlist is set, take the next step and trade with confidence using StocksToTrade’s robust platform. Don’t miss out — grab your 14-day trial for just $7 and experience the edge you need to thrive in today’s fast-paced markets.