
Callan JMB Inc. faces intensified selling pressure as regulatory scrutiny deepens, and its stocks have been trading down by -31.25 percent.
Click Here for a Millionaire's POV on Trading CJMB
SUBSCRIBE FOR ALERTSJOIN 50,000+ ACTIVE TRADERS
Key Takeaways
- Shares of Callan JMB Inc. have faded from recent closes near $2.40, with CJMB now trading closer to the low $2 range on the daily chart.
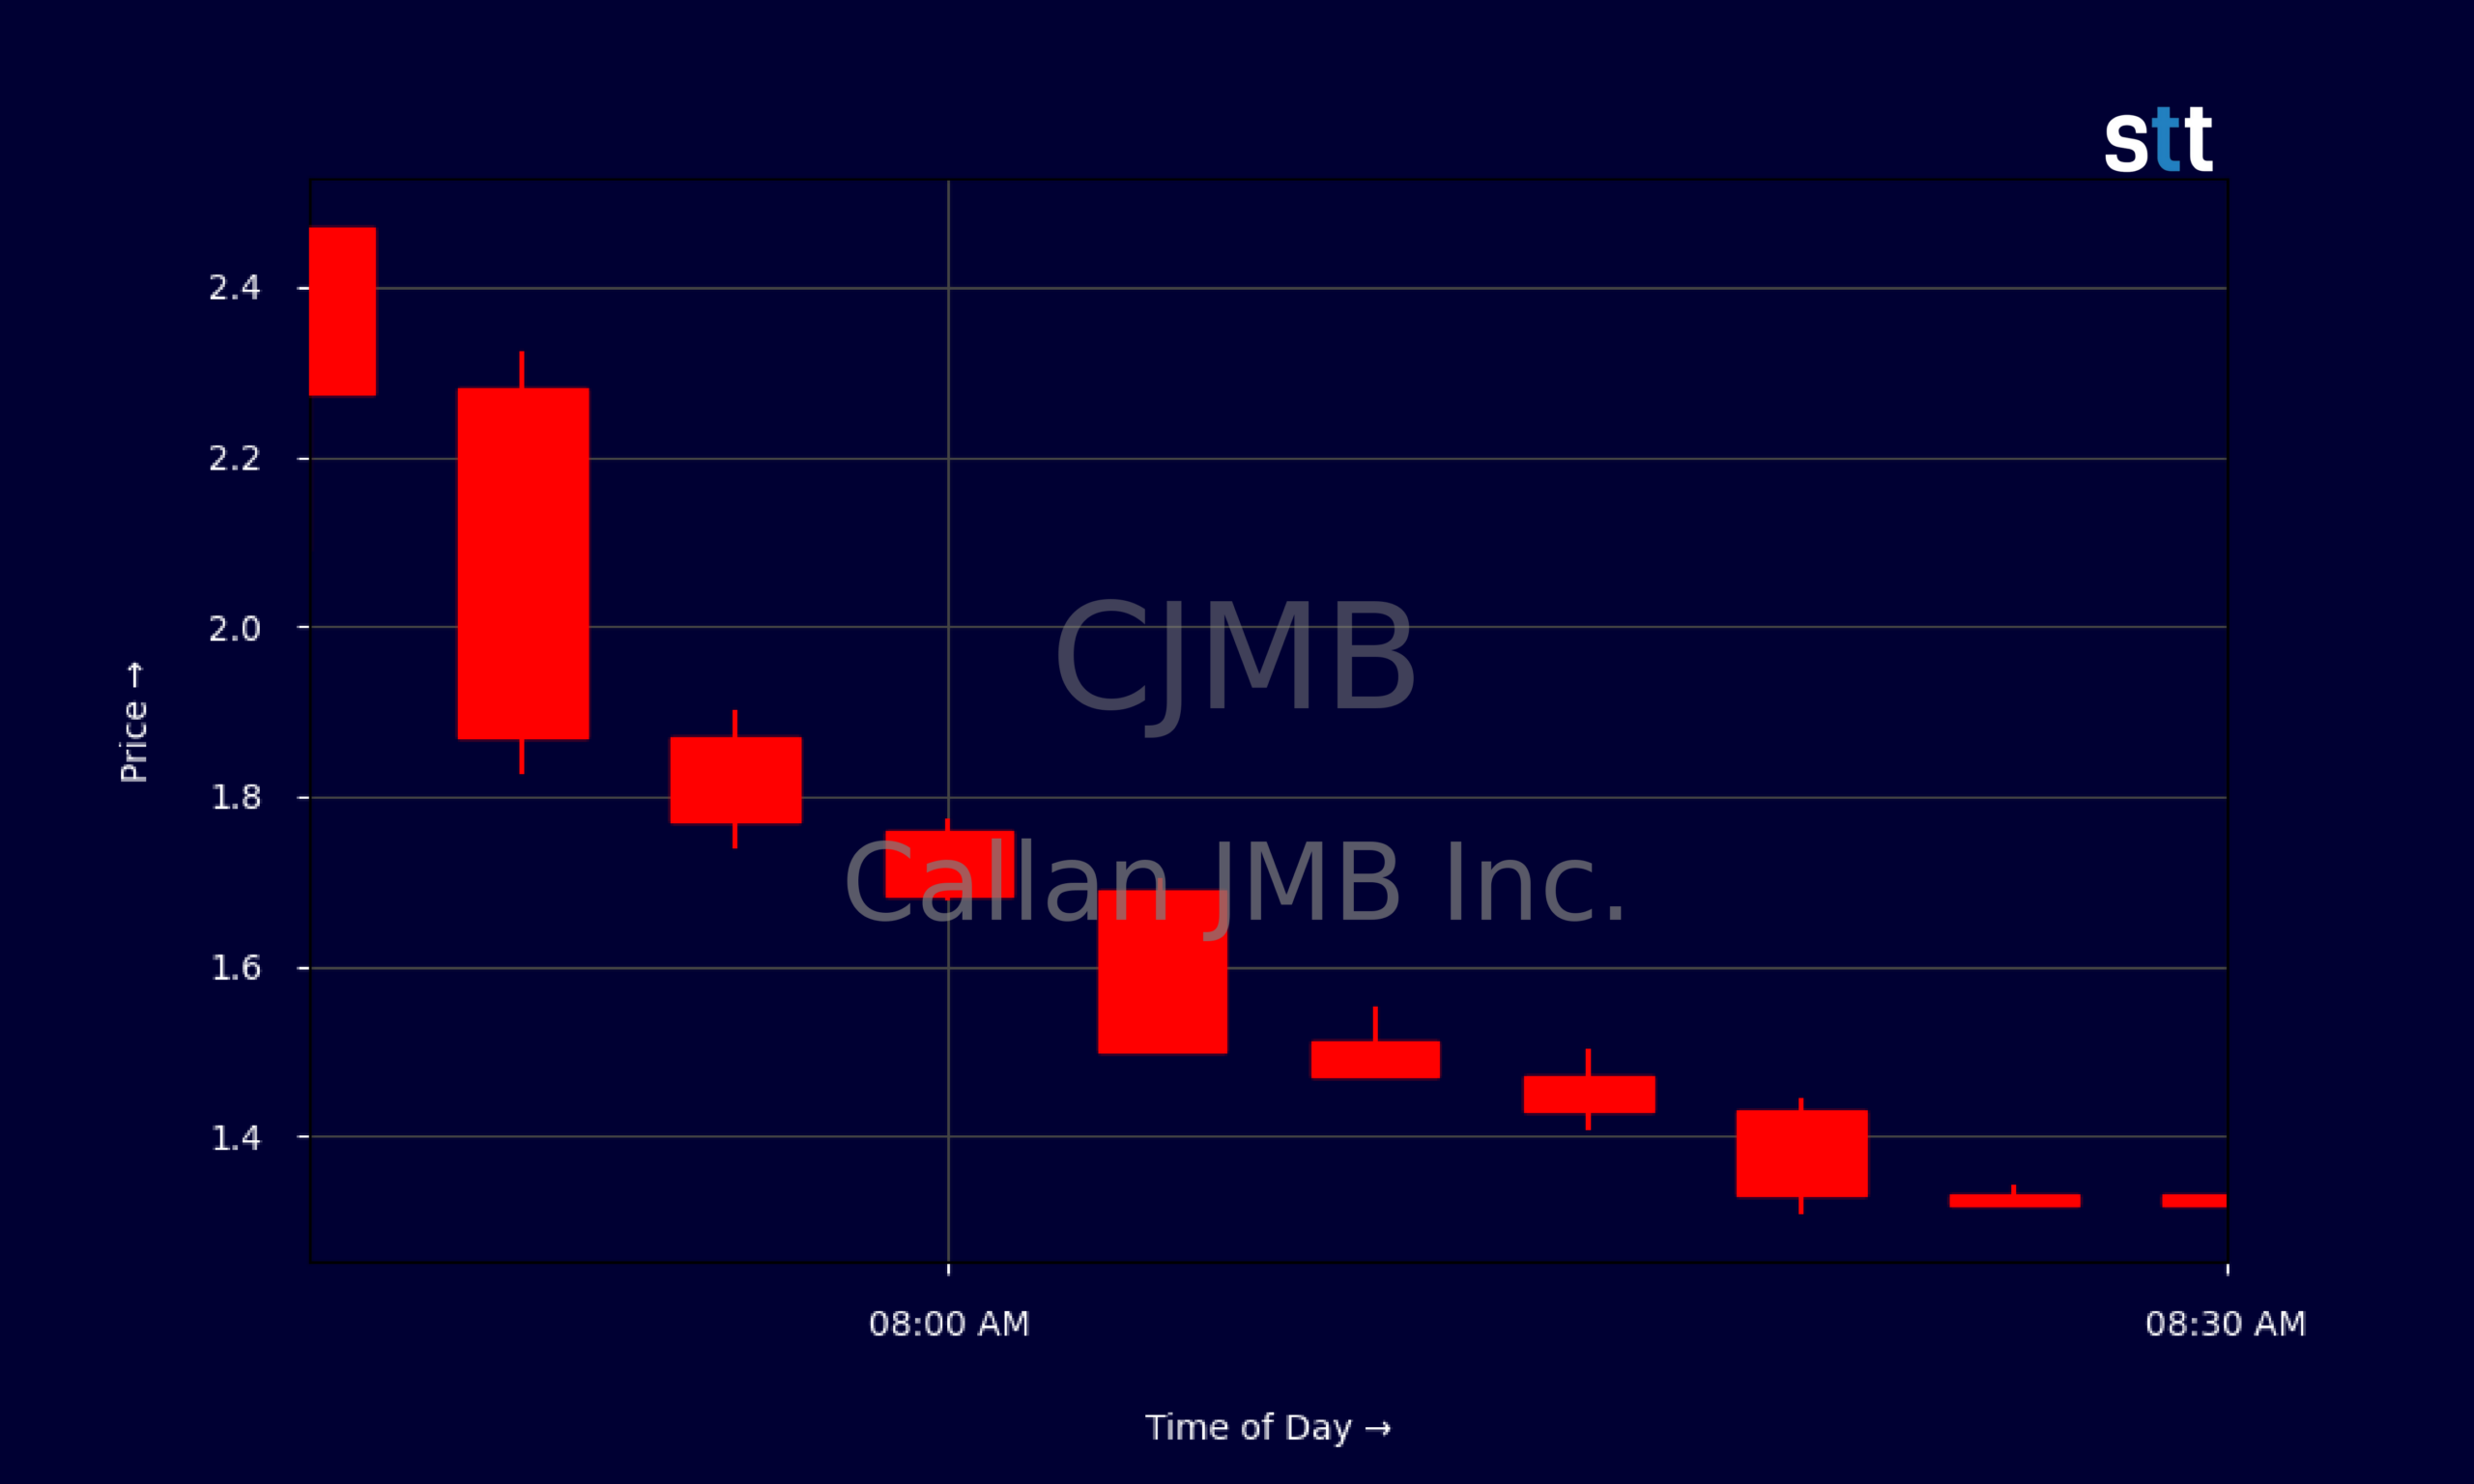
- Intraday CJMB action shows a sharp early-morning flush from $2.47 down into the low $1s, signaling aggressive selling and thin liquidity.
- Financials highlight CJMB’s challenge: roughly $1.4M in quarterly revenue against more than $2.7M in expenses and heavy net losses.
- Leverage is high, with total debt more than triple equity, making CJMB a classic high-risk, high-volatility small-cap for nimble traders.
Live Update At 08:34:11 EDT: On Tuesday, October 20, 2026 Callan JMB Inc. stock [NASDAQ: CJMB] is trending down by -31.25%! Discover the key drivers behind this movement as well as our expert analysis in the detailed breakdown below.
Quick Financial Overview
CJMB is the kind of name momentum traders love to study but respect with tight risk controls. On the income side, Callan JMB Inc. reported about $1.38M in quarterly revenue, yet CJMB booked a net loss of roughly $1.23M. That’s a deep red number, and it shows up in the brutal profit margins. EBIT margin sits near -192%, meaning CJMB spends almost twice its revenue just to run the core business.
Gross margin around 39.9% tells us CJMB’s basic product or service has decent mark-up. The real drag is overhead — more than $2.1M in general and administrative costs. Cash at $0.86M gives CJMB some runway, but not a lot, especially against total liabilities of about $3.77M and long-term debt near $1.79M.
More Breaking News
- QXO Stock Slides As Traders Weigh Cash Burn And Debt
- SNDK Rallies As NAND Pricing And AI Hype Fuel Bull Run
- TCRT Stock Erupts As Alaunos Unveils Velaris Deal And $350M Lifeline
- YMAT Soars As Houston Carbon-Fiber Plant Ignites Trading Frenzy
Leverage is heavy. CJMB’s total debt-to-equity ratio around 3.14 and a lofty price-to-book near 18.9 scream “speculative.” For traders, CJMB is not a stable cash machine; it’s a small, leveraged company burning cash, which often translates into sharp, news-sensitive price swings and potential dilution risk down the road.
Why Traders Are Watching CJMB Price Action
The real story right now is CJMB’s chart. On the multi-day view, Callan JMB Inc. ran from the low $2s, tagged highs near $2.52, and has since drifted lower, closing most recently around $1.92. That pullback from the $2.40–$2.50 zone into the high $1s shows momentum fading and profit-taking stepping in.
Zoom into the 5‑minute intraday data and CJMB looks like a textbook morning unwind. Pre-market or early-session prints around $2.47 quickly gave way to selling down toward $2.09, then a slide into the $1.80s and $1.70s, eventually touching the low $1.30s. This kind of range — more than 40% peak-to-trough in a single morning — makes CJMB a pure trader’s playground, but only for those who respect position size.
CJMB’s fundamentals help explain why the market treats it this way. The company burns cash, with operating cash flow at about -$396,000 for the quarter and free cash flow around -$430,000. Working capital is positive but modest, so CJMB does not have a massive safety net. That keeps sentiment fragile and price highly sensitive to any shift in volume or perception.
For active traders, CJMB is less about steady long-term compounding and more about reading the tape. Key zones on the daily chart include support near $2.10–$2.15 from prior lows and resistance overhead in the $2.40–$2.50 band where CJMB repeatedly stalled. Breaks and failed breaks around those levels will likely set up the next intraday opportunities.
Conclusion
CJMB sits at the intersection of weak fundamentals and strong volatility — exactly where many short-term traders like to hunt. Callan JMB Inc. is losing money, carrying significant debt, and trading at a rich price-to-book multiple for a company with negative returns on assets and equity. That backdrop explains why CJMB whipsaws so hard when liquidity appears or disappears.
At the same time, CJMB’s chart doesn’t lie. Daily candles show repeated pushes into the mid‑$2s followed by swift reversals. Intraday data reveals violent moves from $2.47 down into the low $1s in less than an hour. That’s not a “set and forget” situation; it’s a stock where a late entry or stubborn hold can get punished fast.
For traders studying CJMB, the playbook is straightforward: focus on key price levels, volume surges, and tight risk management. As Tim Bohen, lead trainer with StocksToTrade says, “For me, trading is more about managing risk than finding the next big mover.” Respect the fact that Callan JMB Inc. is a small, leveraged company with ongoing cash burn and no clear profitability in sight. As Tim Sykes likes to remind traders, “Cut losses quickly. They’re small at first, but if you let them grow, they can crush you.” CJMB is a live example of why that rule matters. This article is for educational and research purposes only and is not investment advice.
This is stock news, not investment advice. StocksToTrade News delivers real-time stock market updates tailored to highlight the key catalysts driving short-term price movements. Our coverage is designed for active traders and investors who thrive in fast-moving markets, with a focus on volatile sectors like penny stocks, AI stocks, Robinhood stocks and other momentum plays. From earnings reports and FDA approvals to mergers, new contracts, and unusual trading volume, we break down the events that can spark significant price action.
Looking to level up your trading game? Explore StocksToTrade, the ultimate platform for traders. With powerful tools designed for swing and day trading, integrated news scanning, and even social media monitoring, StocksToTrade keeps you one step ahead.
Check out our quick startup guide for new traders!
- How to Read Stock Charts: A Guide for Beginners
- Trading Plan: 6 Steps to Create One
- How To Create a Stock Watchlist
Ready to build your watchlists? Check out these curated lists:
Once your watchlist is set, take the next step and trade with confidence using StocksToTrade’s robust platform. Don’t miss out — grab your 14-day trial for just $7 and experience the edge you need to thrive in today’s fast-paced markets.