

Boost Run Inc. faces heightened volatility as regulatory probe headlines weigh on investor sentiment; stocks have been trading down by -17.52 percent.
What Traders Need To Know
- Price swung from a breakout above $20 to a weekly close near $17, signaling aggressive profit taking and possible trapped longs.
- Intraday action shows a wide range from the low $20s into the mid $16s, pointing to heavy selling pressure and weak bids.
- Financials for Boost Run Inc. show strong cash generation but deep net losses, a mix that often fuels momentum trading rather than steady accumulation.
- High price-to-sales and rich valuation metrics suggest BRUN trades more on growth expectations and sentiment than on current earnings power.
- Leverage and negative returns on equity make risk management essential for traders in this name.
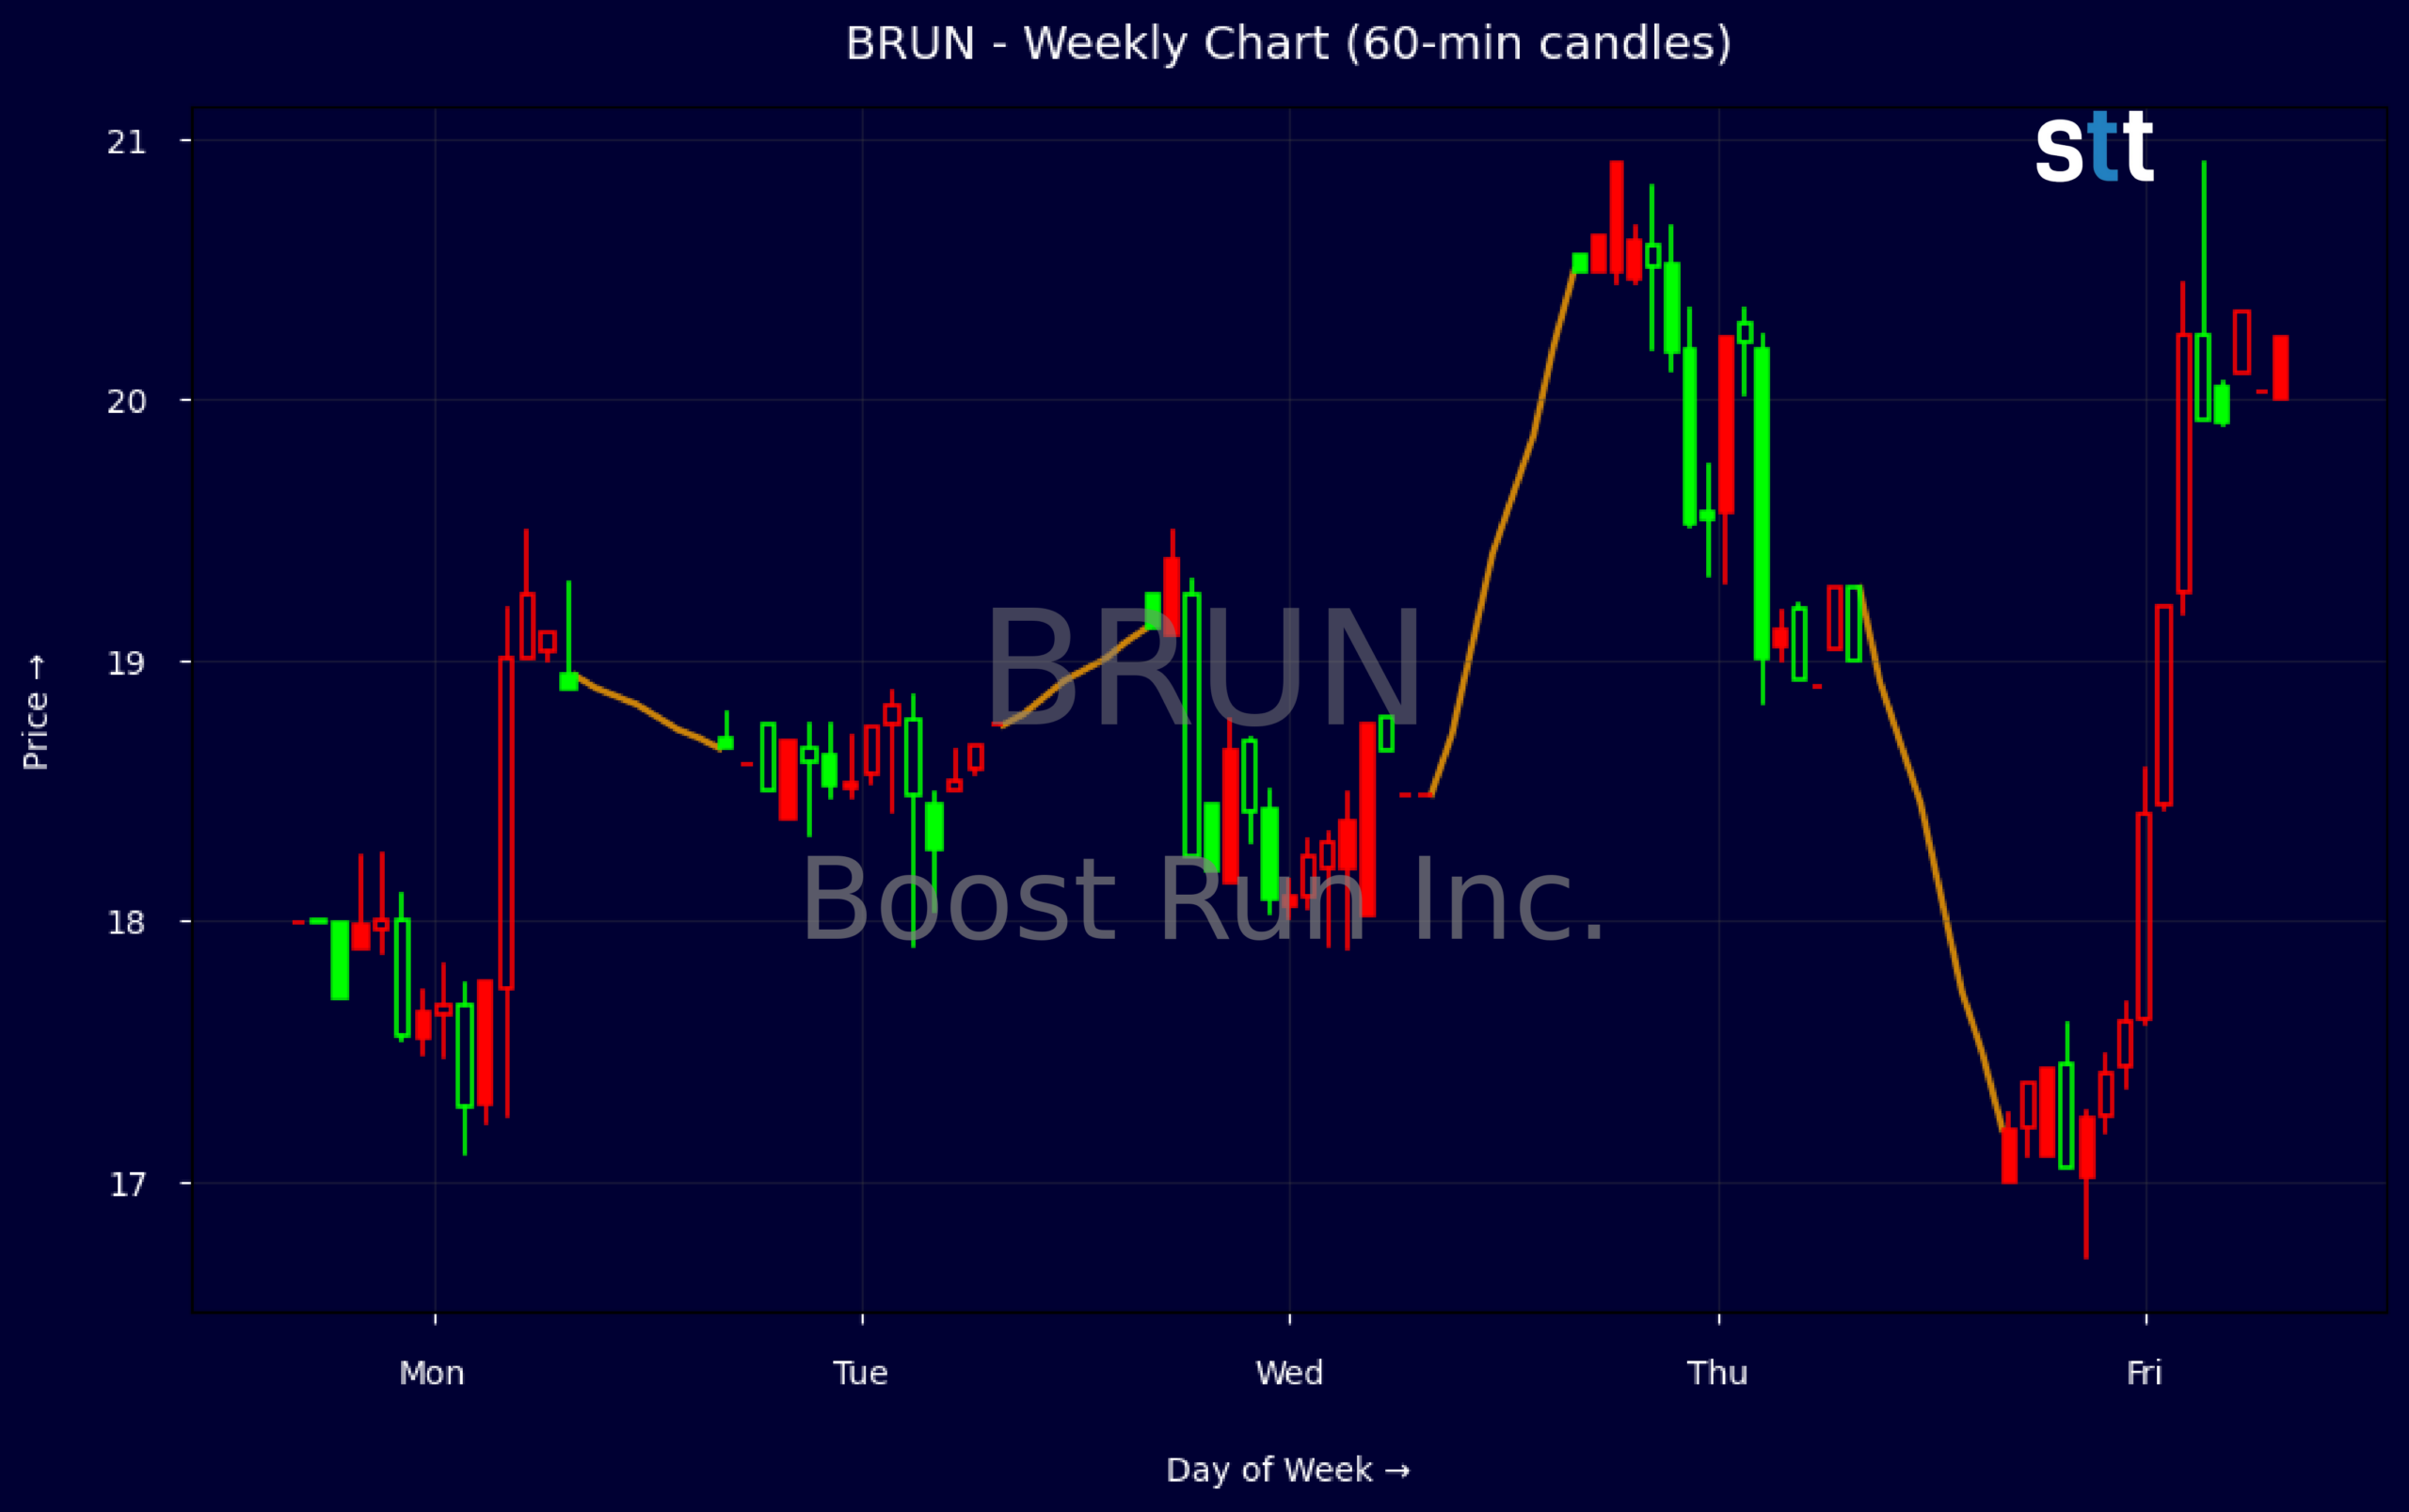
Weekly Update Aug 24 – Aug 28, 2026: On Sunday, August 30, 2026 Boost Run Inc. stock [NASDAQ: BRUN] is trending down by -17.52%! Discover the key drivers behind this movement as well as our expert analysis in the detailed breakdown below.
Technology industry expert:
Analyst sentiment – negative
BRUN occupies a speculative, early-stage niche within Tech/Software & IT Services, with negligible scale (trailing revenue ~$26.9m) but unusually strong cash generation for a pre-profit name (Q2-26 operating cash flow $114m, FCF ~$77m, implying a low ~3x P/FCF versus an extreme ~35x P/S). Fundamentals remain fragile: EBIT margin is -39%, net margin nearly -200%, ROE -77%, and leverage is high (D/E ~2.8x, interest cover ~2.1x, current ratio 0.9x, negative working capital).
Technically, BRUN has transitioned from a sharp mid-week breakout to an aggressive reversal. The stock spiked from ~18 to an intraday high above 20.9 on 26-27 Aug before collapsing to a 17 close, leaving a classic bull-trap pattern on the weekly range (high 20.91, low 17). Short-term 5-minute action shows heavy distribution near 20–20.50 with expanding volume on down candles. Dominant near-term trend is now downward; 17 is critical support, with 20.50 a clear resistance and tactical short-sell level.
More Breaking News
- Snap Stock Slides As Traders Weigh Ads, Regulation, Insider Sale
- Norwegian Cruise Line Stock Jumps As Debt Moves And New Ship Grab Attention
- HL Stock Holds Support As Financial Strength Backs Consolidation
- SNDG ETF Slides As Volatility Grips Short-Term Traders
With no incremental news flow, the setup is driven by positioning rather than fundamentals, and BRUN screens weaker than broader Tech and Software & IT Services, which generally offer positive margins, lower leverage, and clearer growth visibility. Near-term, I expect range-bound to lower trading between 17 and 20, with risk of a breakdown toward the mid-teens if 17 fails. Upside is capped at 21 without a concrete profitability or de-leveraging catalyst; 21–22 is strong resistance.
Quick Financial Overview
Boost Run Inc. sits in a strange but familiar spot for high-beta names: strong cash flow, heavy losses, and a chart that moves fast. Quarterly revenue of about $26.9M and gross margin above 100% show an asset-light or accounting-driven model, but profit margins tell the real story, with net margin near -198%. On a trailing basis, BRUN posts negative EBIT and pretax margins, confirming that the business is not yet sustainably profitable.
At the same time, the balance sheet is not weak on liquidity alone. Cash and equivalents around $120.2M plus meaningful free cash flow of roughly $77.4M in the recent period give Boost Run Inc. breathing room. But leverage is significant: total debt-to-equity sits near 2.75, and a leverage ratio of 7.4 shows the company is leaning on debt to fund growth. Return on equity around -76.7% and return on assets near -10.3% underline that capital is not yet earning its keep.
Valuation for BRUN is rich by classic metrics. Price-to-sales near 35 and price-to-book around 13.5 signal that traders are paying up for future potential, not current earnings. Cash flow multiples are more reasonable, with price-to-cash-flow near 3 and price-to-free-cash around 3.5, reflecting strong operating cash dynamics. For active traders, that mix — high sales and book multiples but decent cash flow backing — often supports sharp momentum runs and equally sharp unwinds when sentiment shifts.
Conclusion
From a trading standpoint, BRUN just flashed a strong caution signal. On the weekly chart, Boost Run Inc. pushed from the high teens to a breakout around $20.55, then reversed hard to close the week at roughly $17. That kind of failed breakout often leaves trapped momentum longs and attracts short-term sellers who lean on any bounce toward prior highs. The intraday wipe from about $20.2 down into the $16.7 area in a single session confirms that liquidity can vanish fast when bids step away.
Under the hood, the story is classic high-growth, high-risk. Boost Run Inc. is generating solid operating cash flow and free cash flow while still reporting large net losses and negative returns on equity. Layer in a leveraged balance sheet and premium valuation multiples, and you get a stock that can move several dollars in either direction on sentiment alone. Traders should treat BRUN as a tactical vehicle, not a set-and-forget holding, and define risk tightly around the recent low-to-mid $17s support area and the failed breakout zone near $20–$21.
For educational and research purposes, the key is discipline. Size positions with the volatility in mind, respect both the liquidity and the leverage on the balance sheet, and avoid chasing extended moves. As Tim Bohen, lead trainer with StocksToTrade says, “Time and experience have taught me that missed opportunities are part of the game. There’s always another setup around the corner.” That mindset is crucial when dealing with volatile names like BRUN, where patience and selectivity can help keep traders out of the worst spots. As I often tell my students, “The market rewards traders who plan their exits before they enter; in names like BRUN, your exit strategy matters more than your entry.””,”scores”:{“risk-level”:”high”},”trade”:”false”
This is stock news, not investment advice. StocksToTrade News delivers real-time stock market updates tailored to highlight the key catalysts driving short-term price movements. Our coverage is designed for active traders and investors who thrive in fast-moving markets, with a focus on volatile sectors like penny stocks, AI stocks, Robinhood stocks and other momentum plays. From earnings reports and FDA approvals to mergers, new contracts, and unusual trading volume, we break down the events that can spark significant price action.
Looking to level up your trading game? Explore StocksToTrade, the ultimate platform for traders. With powerful tools designed for swing and day trading, integrated news scanning, and even social media monitoring, StocksToTrade keeps you one step ahead.
Check out our quick startup guide for new traders!
- How to Read Stock Charts: A Guide for Beginners
- Trading Plan: 6 Steps to Create One
- How To Create a Stock Watchlist
Ready to build your watchlists? Check out these curated lists:
Once your watchlist is set, take the next step and trade with confidence using StocksToTrade’s robust platform. Don’t miss out — grab your 14-day trial for just $7 and experience the edge you need to thrive in today’s fast-paced markets.