

Blaize Holdings Inc. stocks have been trading down by -22.63 percent amid bearish sentiment following its latest financing and restructuring news.
Market Insights For Active Traders
- Price has broken down on both weekly and intraday charts, signaling clear short-term selling pressure.
- Recent intraday action shows a sharp drop from the mid-$1.60s to near $1.30, highlighting volatility risk.
- Weekly candles for BZAI cluster between $1.70 and $1.80 before a sudden breakdown toward $1.37.
- Operating losses and deeply negative margins at Blaize Holdings Inc. raise questions about how long the current cash runway can support growth.
- Traders are watching whether the $1.30–$1.35 area holds as a short-term line in the sand.
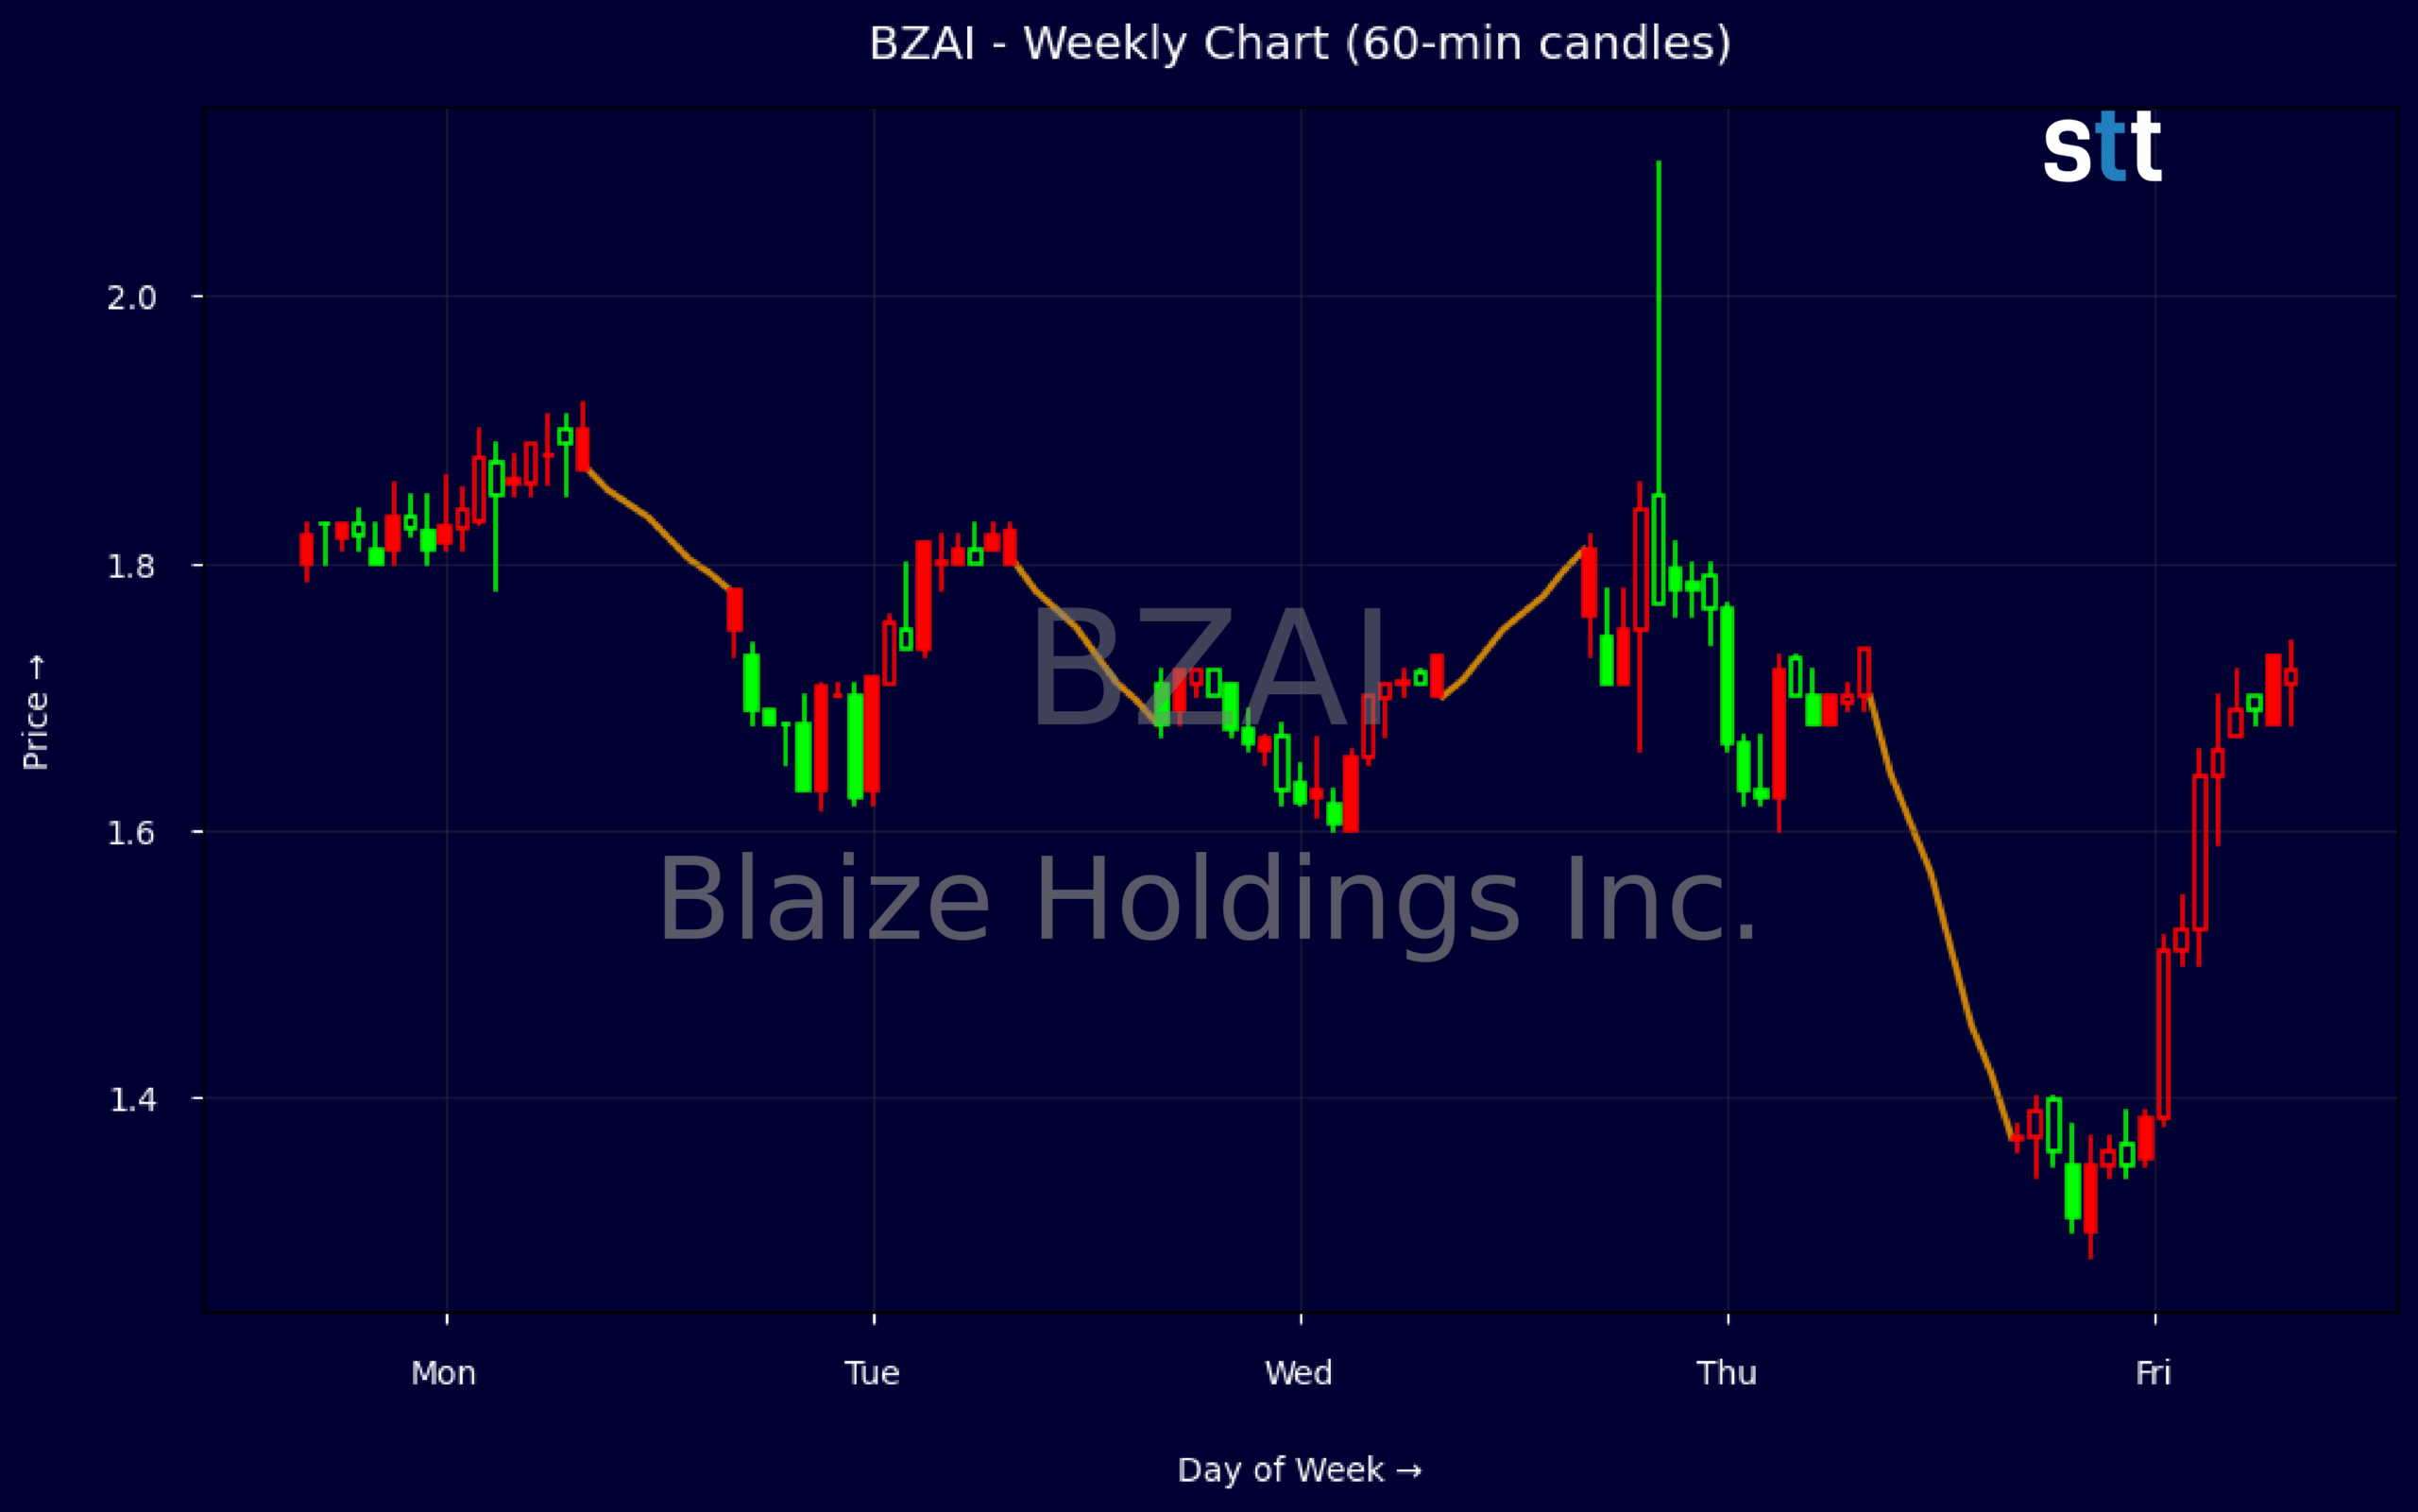
Weekly Update May 11 – May 15, 2026: On Saturday, May 16, 2026 Blaize Holdings Inc. stock [NASDAQ: BZAI] is trending down by -22.63%! Discover the key drivers behind this movement as well as our expert analysis in the detailed breakdown below.
Finance industry expert:
Analyst sentiment – negative
BZAI occupies a niche AI/analytics segment within diversified financial services but is fundamentally weak. Revenue of only $2.7m in Q1 against operating expenses of $26.0m and EBITDA of -$22.7m yields catastrophic margins (EBIT margin ~-830%). Returns on assets (-102%+) and equity (-2600%+) are unsustainably poor, and accumulated losses are huge (retained earnings -$659m). Offsetting this, the balance sheet shows low leverage (debt/equity ~0.04) and strong liquidity (current ratio 2.2, cash ~$33m), providing near-term solvency but not a viable standalone model yet.
Technically, the stock is in a short-term downtrend. The week shows lower highs and a sharp breakdown from the $1.80–1.82 area to a $1.31 low, with closes sliding toward $1.37, signaling distribution. Intraday 5-minute candles likely show heavy selling on increased volume on the breakdown day, followed by weak, low-volume bounces. The actionable level is $1.30: a break and sustained trade below this should be treated as a sell trigger, with failed rallies into $1.70–1.80 as tactical short entries.
More Breaking News
- MU Stock Slides As China’s CXMT DRAM Breakthrough Rattles Traders
- RKT Stock Dips After Big Q3 Earnings Beat
- Global Payments Stock Climbs As Analysts Bet On Worldpay Upside
- IOVA Stock Collapses As Traders Flee Biotech High‑Flier
With no fresh positive news and given sector benchmarks, BZAI severely underperforms typical finance and diversified financial peers on profitability, scalability, and capital efficiency. The only clear near-term support is around $1.30; below that, downside accelerates. Overhead resistance is $1.70 initially, then $1.80. My verdict is Negative: risk/reward is unattractive for long-only investors. Absent a clear, credible path to profitability, fair value skews below current levels, targeting roughly $1.00 over the next 6–12 months.
Quick Financial Overview
Blaize Holdings Inc. shows a classic high-growth, high-burn profile. Quarterly revenue is about $2.74M against total expenses of roughly $26.13M, driving a net loss near $22.65M and diluted EPS of -$0.19. On a trailing basis, revenue of about $38.63M supports a price-to-sales ratio near 5.65, which is rich given profit margins above -500%. That kind of negative margin tells traders this is a story stock, not a cash machine.
The balance sheet for BZAI is more solid than the income statement. Cash and equivalents are about $33.22M, with total assets near $70.75M and working capital around $38.84M. Debt is modest, with long-term debt of only $0.64M and a total debt-to-equity ratio of 0.04. Current and quick ratios of 2.2 and 1.1 suggest the company can cover near-term obligations, but the cash burn of roughly $12.6M in operating cash flow per quarter limits that comfort.
On the chart, the weekly data show BZAI trading mostly in the $1.70–$1.80 zone before a breakdown to a $1.31 open and $1.37 close in the latest week. Intraday, a single 5-minute bar captures a violent drop from $1.64–$1.66 down to $1.28 before closing at $1.31. That kind of wide intraday range signals poor liquidity and emotional trading. For active traders, these moves frame $1.70–$1.80 as overhead supply and the low $1.30s as short-term support.
Conclusion
This is stock news, not investment advice. StocksToTrade News delivers real-time stock market updates tailored to highlight the key catalysts driving short-term price movements. Our coverage is designed for active traders and investors who thrive in fast-moving markets, with a focus on volatile sectors like penny stocks, AI stocks, Robinhood stocks and other momentum plays. From earnings reports and FDA approvals to mergers, new contracts, and unusual trading volume, we break down the events that can spark significant price action.
Looking to level up your trading game? Explore StocksToTrade, the ultimate platform for traders. With powerful tools designed for swing and day trading, integrated news scanning, and even social media monitoring, StocksToTrade keeps you one step ahead.
Check out our quick startup guide for new traders!
- How to Read Stock Charts: A Guide for Beginners
- Trading Plan: 6 Steps to Create One
- How To Create a Stock Watchlist
Ready to build your watchlists? Check out these curated lists:
Once your watchlist is set, take the next step and trade with confidence using StocksToTrade’s robust platform. Don’t miss out — grab your 14-day trial for just $7 and experience the edge you need to thrive in today’s fast-paced markets.