
Banco Santander Brasil SA stocks have been trading down by -11.89 percent amid heightened concerns over Brazil’s weakening economic outlook.
Click Here for a Millionaire's POV on Trading BSBR
SUBSCRIBE FOR ALERTSJOIN 50,000+ ACTIVE TRADERS
Key Takeaways
- Price action in BSBR shows a sharp break from the $5.70–$5.90 area down toward $4.90, putting Banco Santander Brasil SA back near August levels.
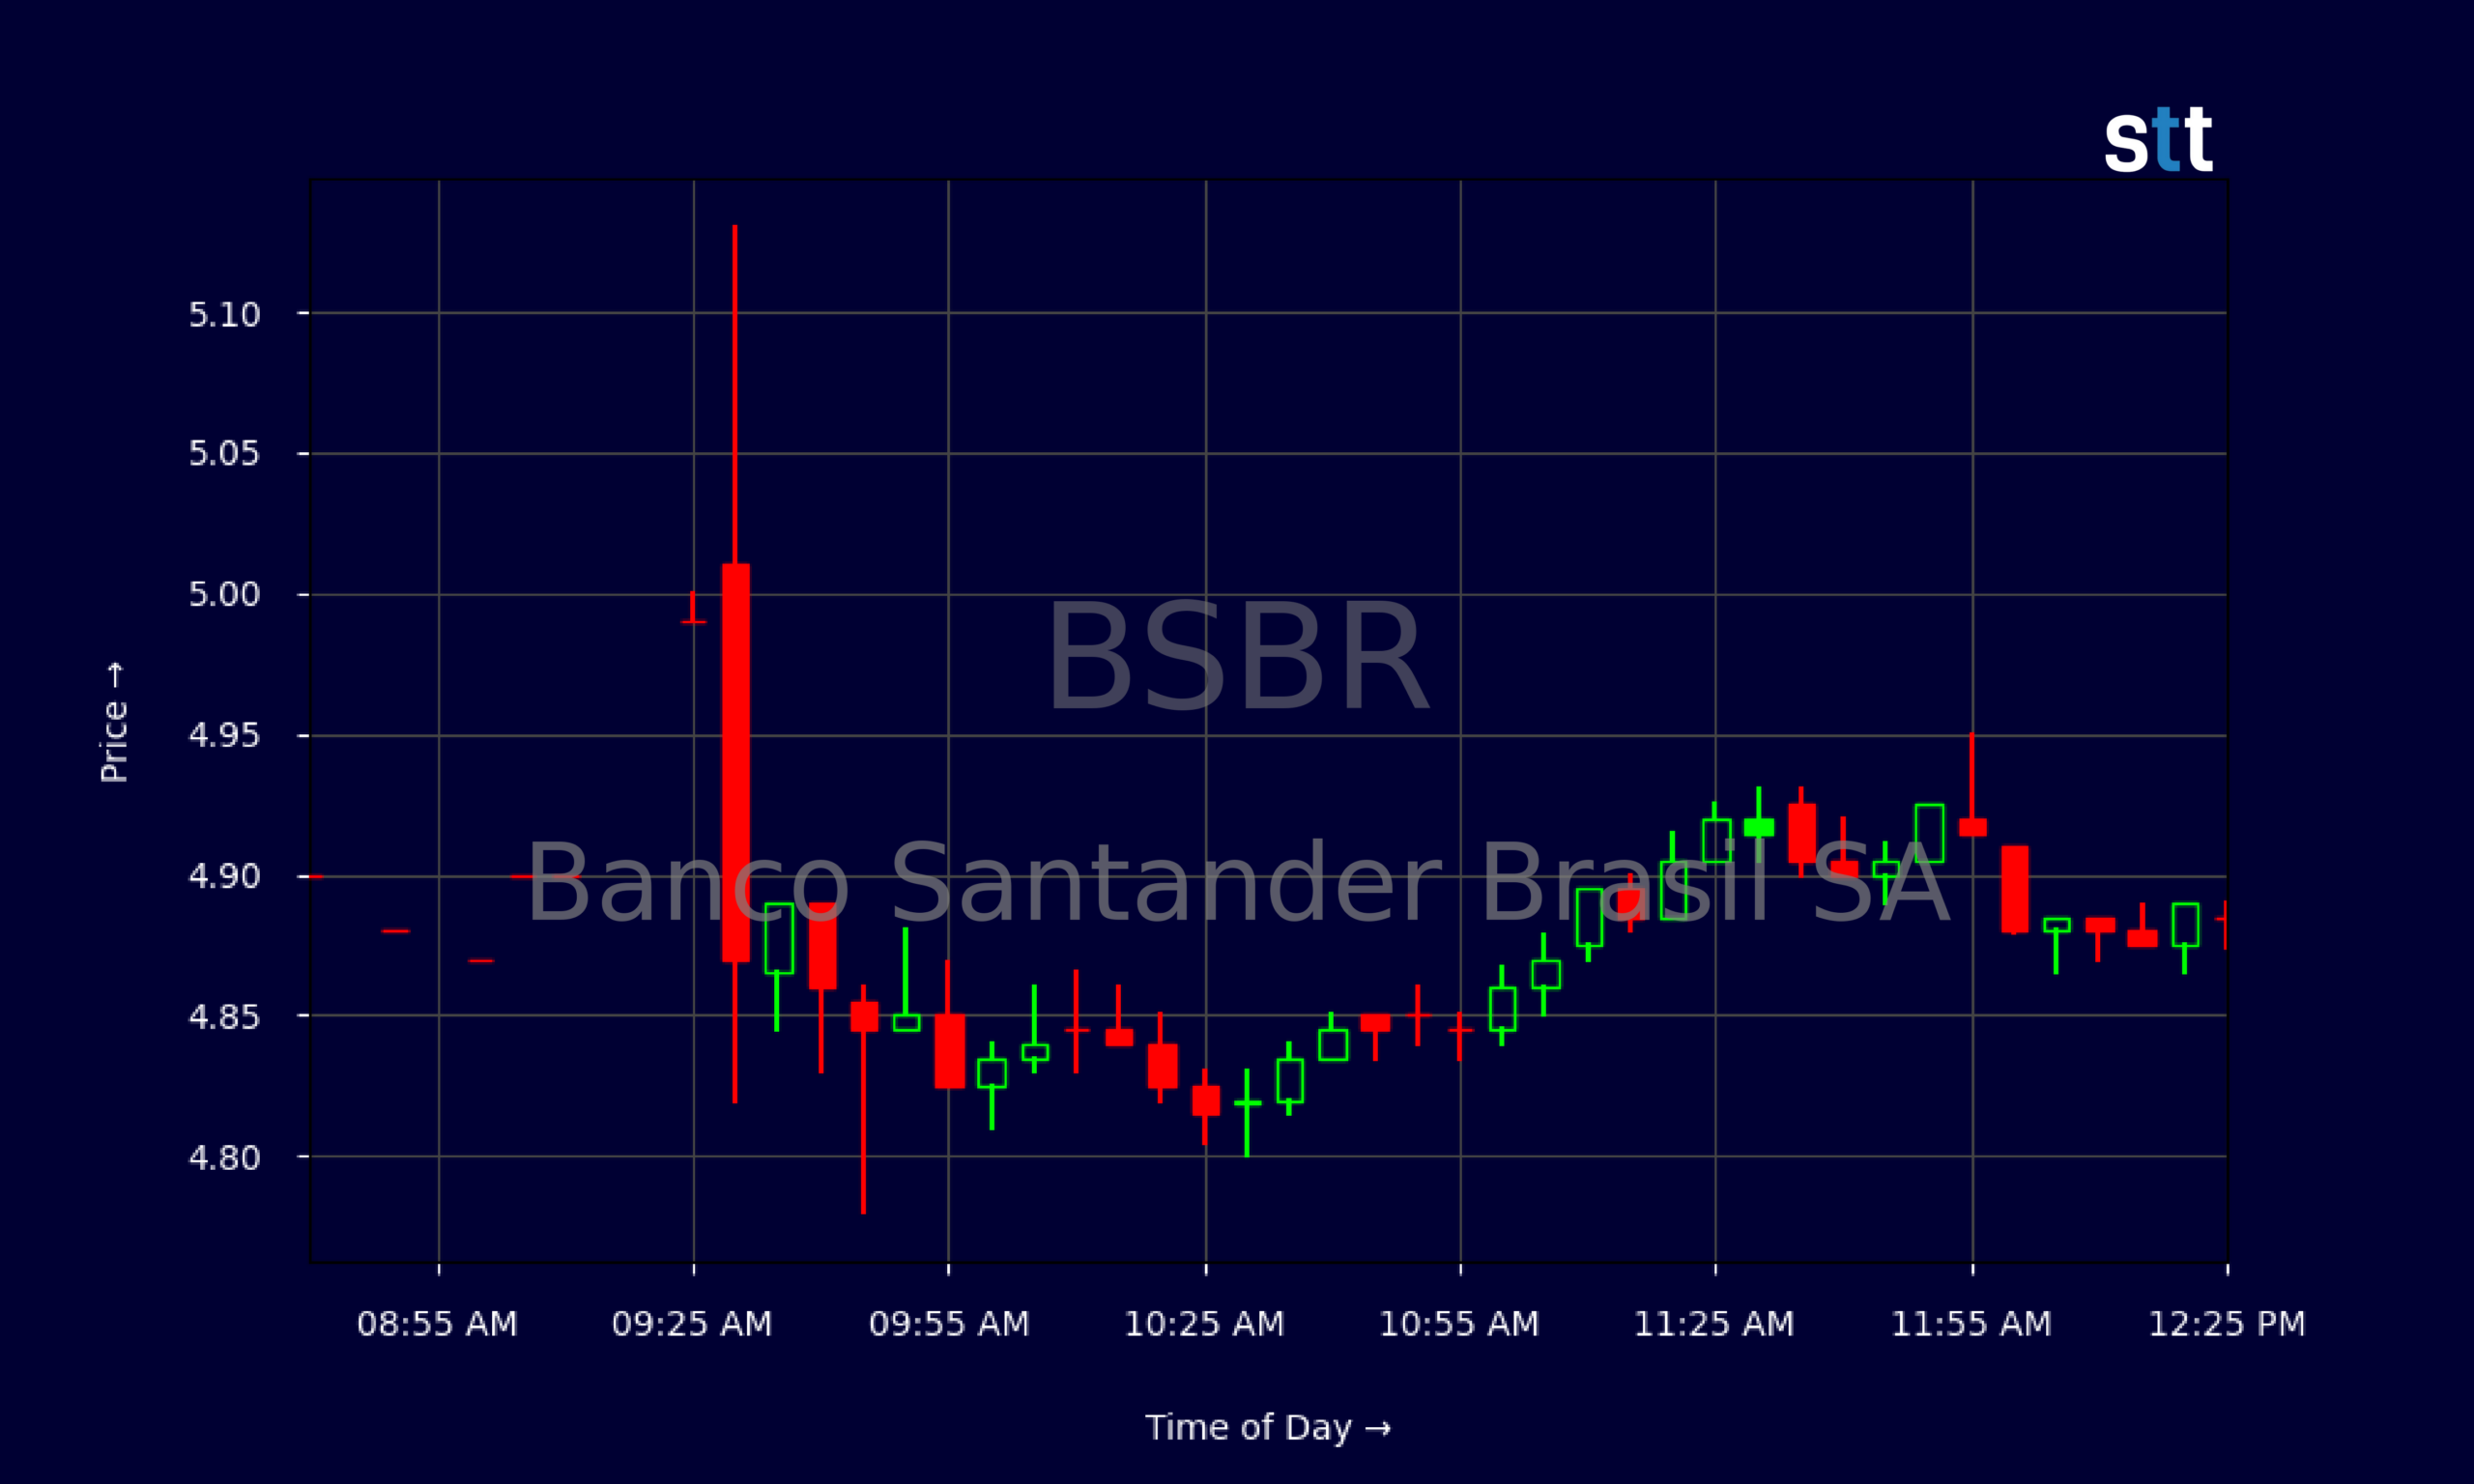
- Recent intraday trading in BSBR is tight, with most 5‑minute candles stuck between $4.82 and $4.92, signaling short‑term consolidation after the selloff.
- Banco Santander Brasil SA posts about $65.22B in annual revenue, but shrinking three‑year revenue trends suggest growth pressure even as margins stay positive.
- BSBR carries a debt‑heavy balance sheet typical of a major bank, with leverage near 18x equity, rewarding trends only if credit quality stays stable.
- With BSBR trading well below book value per share, active traders are watching for a bounce or a breakdown from this key support band.
Live Update At 12:32:52 EDT: On Monday, October 26, 2026 Banco Santander Brasil SA stock [NYSE: BSBR] is trending down by -11.89%! Discover the key drivers behind this movement as well as our expert analysis in the detailed breakdown below.
Quick Financial Overview
BSBR is not a tiny spec name; Banco Santander Brasil SA is a large Brazilian bank with roughly $65.22B in annual revenue. That scale matters. It tells traders BSBR is tied to big macro themes, not just headline noise.
The margin picture is mixed. Pretax profit margin sits near 22.8%, and total profit margin around 23.06%. For a bank, that shows BSBR can still earn solid money on its loan book and fee streams. At the same time, revenue growth over the last three years is down about 28.49%, while the five‑year number is up 21.91%. That combo says BSBR had a strong earlier run, then hit a cooler period.
More Breaking News
- TDW Climbs As Tidewater Inc. Shows Steady Momentum
- ITUB Stock Holds Range As Brazil Banking Giant Firms Up Fundamentals
- AXTI Stock Jumps As Traders Pile In Ahead Of Earnings
- JBLU Stock Slides As Wall Street Slashes Targets On Fuel Pain
On valuation, BSBR trades at a P/E around 18.59 and a price‑to‑sales near 5.46. Price‑to‑book is about 1.78 against a book value per share of 16.75. For traders, that means Banco Santander Brasil SA is not some deep‑value outlier, but it is also not wildly expensive. Add a roughly 5.8% dividend yield, and BSBR becomes a classic yield‑plus‑price‑action bank play rather than a high‑growth story.
Why Traders Are Watching BSBR Price Action
The chart is where BSBR gets interesting. Over the recent stretch, Banco Santander Brasil SA slid from closes around $5.77–$5.98 into today’s $4.89 finish. That is a meaningful pullback, roughly 15–20% off the local highs. When a large bank stock like BSBR moves that far in a short window, traders pay attention.
Look at the daily candles. From 2026/10/01 through 2026/10/23, BSBR mostly held above $5.30 and even tagged highs above $6.00. Then 2026/10/26 opened around $5.01 and flushed as low as $4.78 before stabilizing just under $4.90. That long lower‑timeframe slide shows clear supply stepping in. Bulls lost control; bears drove the bus.
Now switch to the intraday 5‑minute chart. After the gap‑down and early volatility, BSBR spent much of the session chopping between $4.82 and $4.92, with small candles and narrow wicks. That is classic consolidation after a trend day. Volume‑weighted price action hovers near $4.87–$4.89, which many short‑term traders will mark as an intraday pivot.
For active traders, BSBR now sits at a decision point. A push back over the morning high near $5.13 would suggest a short squeeze or at least a dead‑cat bounce. A breakdown below $4.78 opens the door to a deeper slide. Banco Santander Brasil SA is giving a clean technical map: defined support, defined resistance, and a well‑traveled range in between.
Conclusion
Banco Santander Brasil SA is showing the kind of pullback pattern that experienced traders know well. BSBR has decent profitability, a big loan book, and the usual high leverage you expect in a major bank. The numbers alone do not scream disaster, but the three‑year revenue decline tells you growth is not on cruise control. When a stock like BSBR slips this fast, the chart becomes your main tool.
Right now, BSBR is wedged between short‑term support just under $4.80 and overhead resistance around $5.10–$5.30. Traders studying Banco Santander Brasil SA will map their plans around those levels: reactive longs near support, reactive shorts near resistance, and quick cuts if price moves against them. The generous dividend yield adds another layer, but for active trading, price action still runs the show.
As Tim Sykes likes to say, “The market rewards prepared traders, not hopeful gamblers.” That dovetails with another core trading principle: As Tim Bohen, lead trainer with StocksToTrade says, “Preparation is half the trade. By the time the bell rings, my decisions are nearly made.”. BSBR is a live case study of that idea. Banco Santander Brasil SA has given clear signals on both the daily and intraday charts. The traders who do the work—mark levels, track ranges, respect risk—will be ready the next time BSBR breaks out of this consolidation, whichever direction it chooses. This analysis is for educational and research purposes only, but the lessons in BSBR’s tape are very real.
This is stock news, not investment advice. StocksToTrade News delivers real-time stock market updates tailored to highlight the key catalysts driving short-term price movements. Our coverage is designed for active traders and investors who thrive in fast-moving markets, with a focus on volatile sectors like penny stocks, AI stocks, Robinhood stocks and other momentum plays. From earnings reports and FDA approvals to mergers, new contracts, and unusual trading volume, we break down the events that can spark significant price action.
Looking to level up your trading game? Explore StocksToTrade, the ultimate platform for traders. With powerful tools designed for swing and day trading, integrated news scanning, and even social media monitoring, StocksToTrade keeps you one step ahead.
Check out our quick startup guide for new traders!
- How to Read Stock Charts: A Guide for Beginners
- Trading Plan: 6 Steps to Create One
- How To Create a Stock Watchlist
Ready to build your watchlists? Check out these curated lists:
Once your watchlist is set, take the next step and trade with confidence using StocksToTrade’s robust platform. Don’t miss out — grab your 14-day trial for just $7 and experience the edge you need to thrive in today’s fast-paced markets.