

Banco Bradesco Sa stocks have been trading down by -2.7 percent amid heightened concerns over Brazil’s banking sector outlook.
Key Takeaways
- Shares of Banco Bradesco Sa have slipped from late-July highs near $3.73 to about $3.21, signaling a steady pullback on the daily chart.
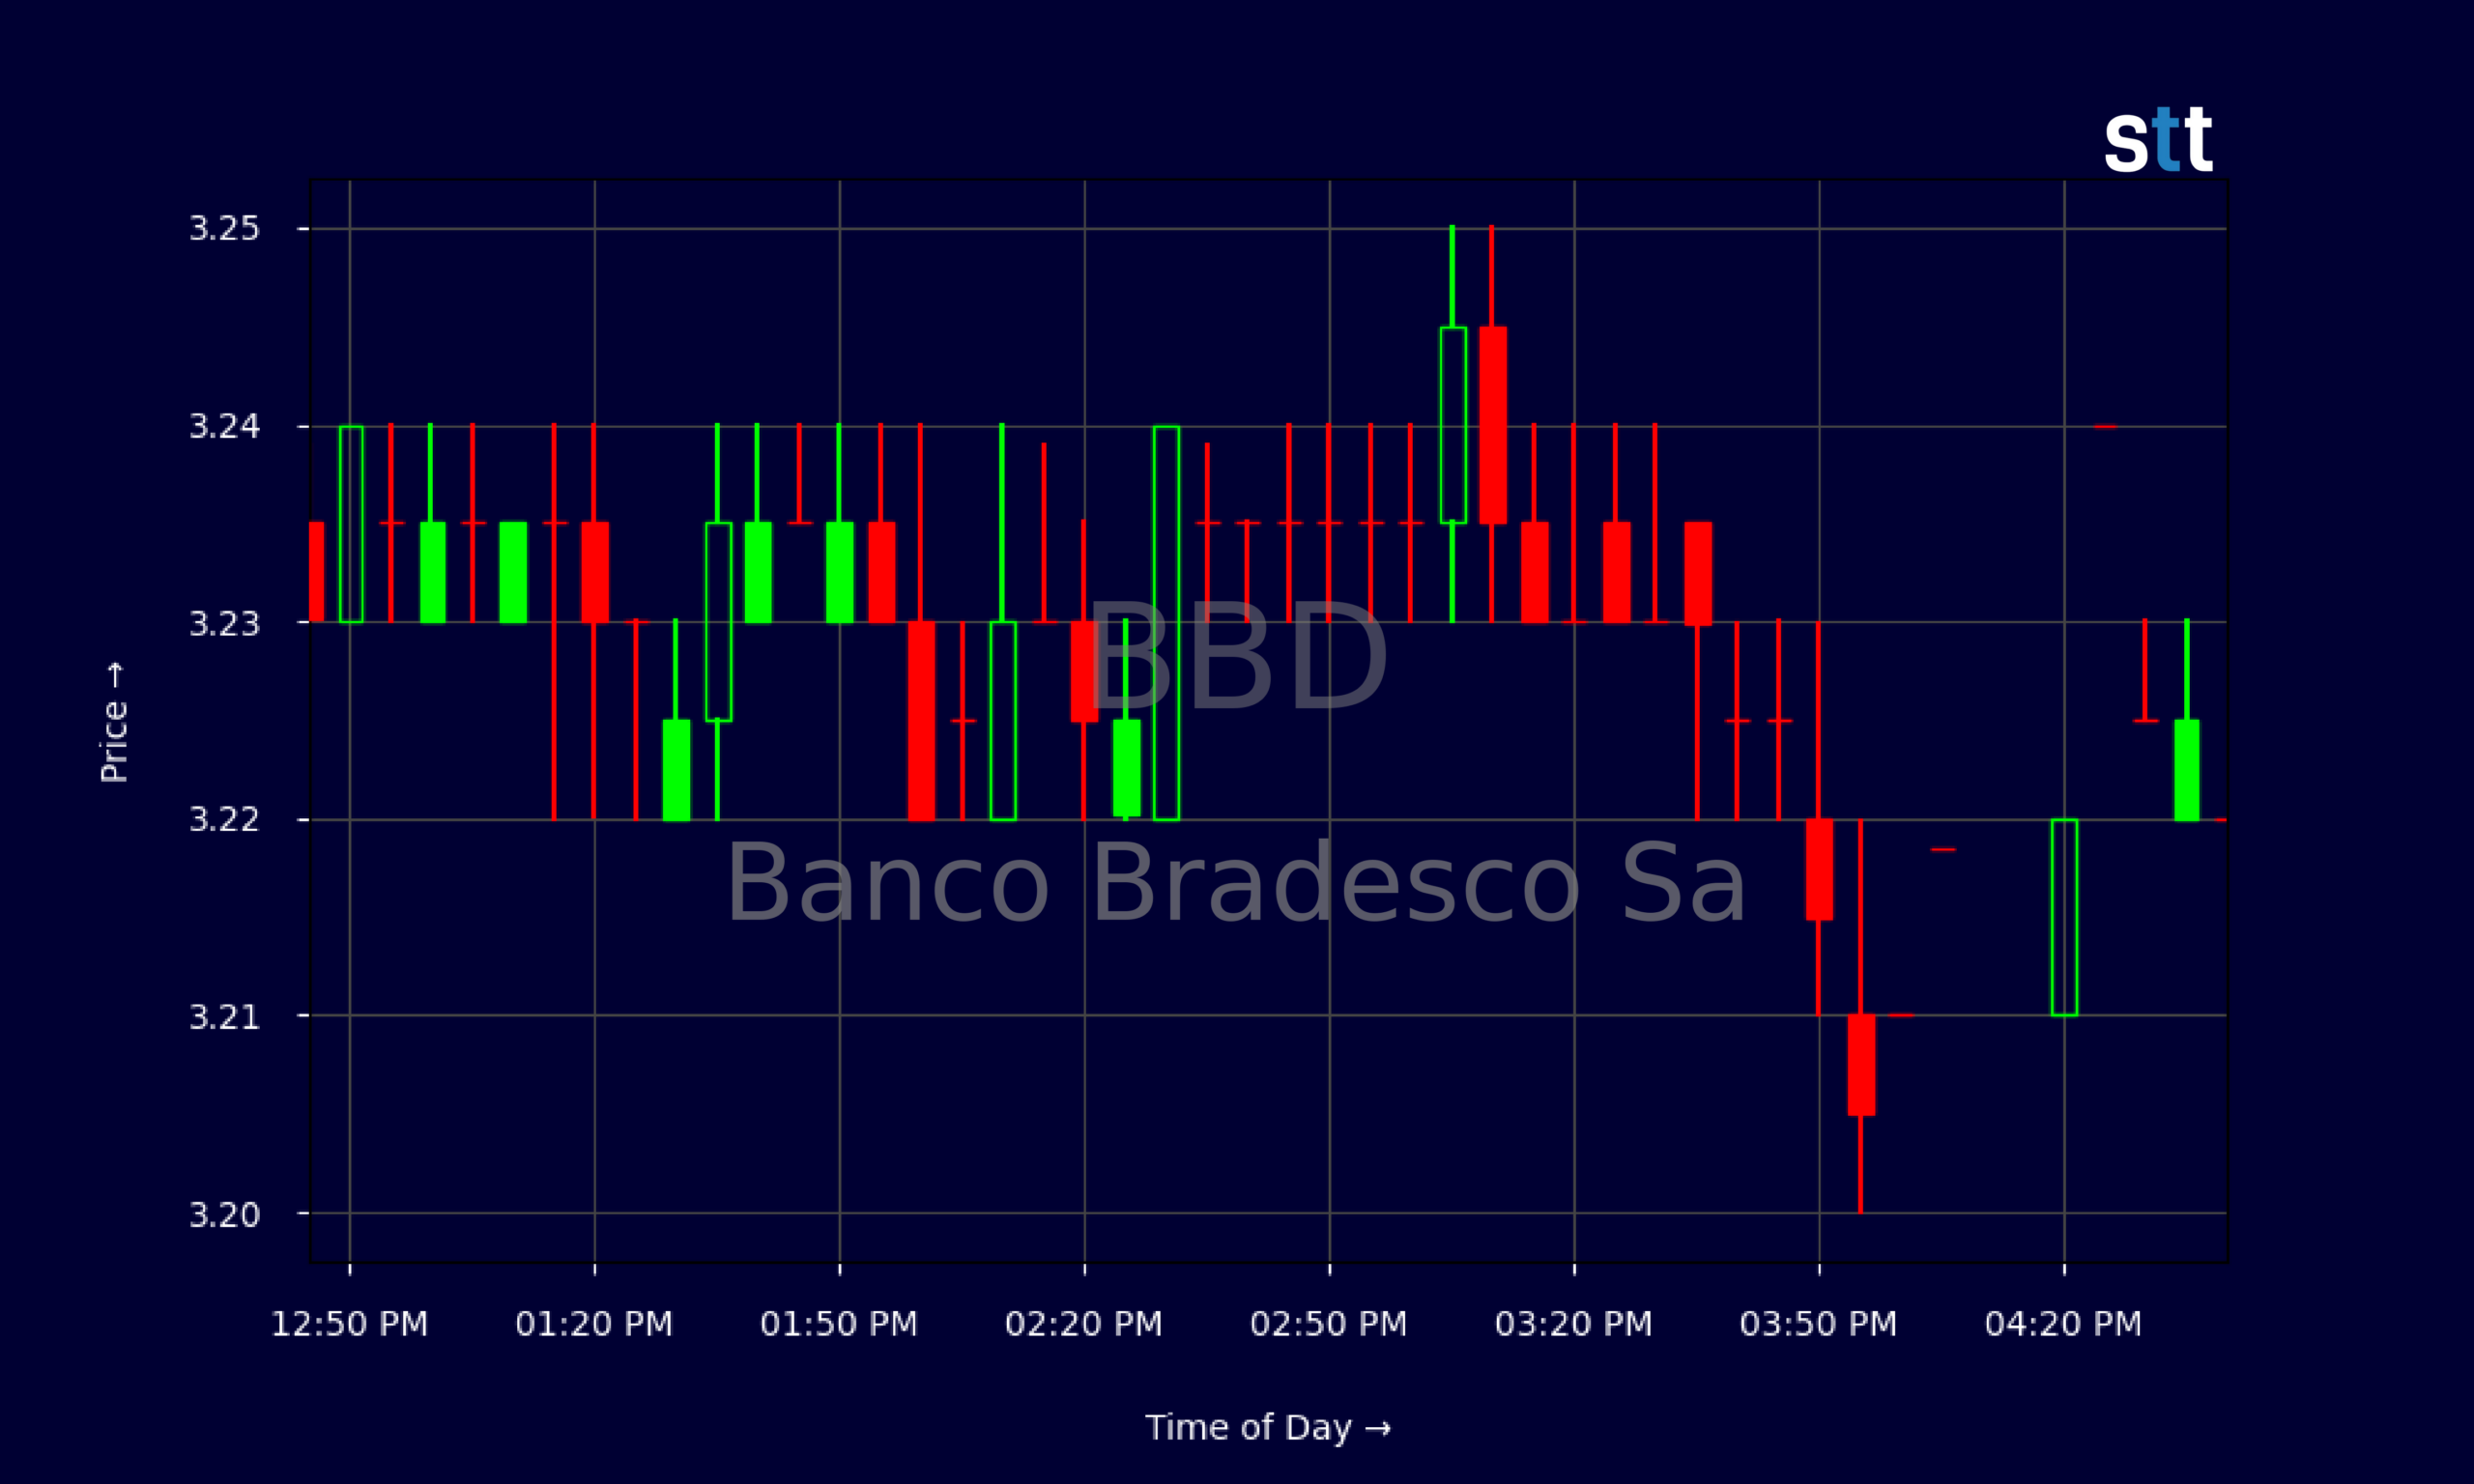
- Intraday BBD action shows a very narrow range around $3.22–$3.24, suggesting consolidation and indecision among short-term traders.
- Banco Bradesco Sa posts a low price-to-earnings ratio near 8, with a price-to-book just over 1, keeping BBD in classic value territory.
- A high leverage ratio and modest return on equity mean traders must weigh balance-sheet strength against profitability trends.
- Active traders are watching whether BBD holds the $3.20 area or breaks toward the next support zone.
Live Update At 16:56:56 EDT: On Tuesday, August 11, 2026 Banco Bradesco Sa stock [NYSE: BBD] is trending down by -2.7%! Discover the key drivers behind this movement as well as our expert analysis in the detailed breakdown below.
Quick Financial Overview
Banco Bradesco Sa gives traders a mix of value metrics and cautious signals. BBD trades around $3.21 after fading from the $3.70s over the past few weeks. That slide shows lower highs and lower closes, a simple downtrend on the daily chart that short-term traders respect.
On the fundamentals side, BBD generated about $105.3B in revenue, yet the three-year revenue trend shows a steep drop, reminding traders that this is not a pure growth story. The pretax profit margin near 34.6% looks strong on paper, but return on equity sits around 4%, which is low for a major bank. Return on assets is only 0.27%, reflecting how hard Banco Bradesco Sa must work each year to squeeze earnings out of its large balance sheet.
More Breaking News
- REGN Jumps As Libtayo Data And Analyst Upgrades Fuel Bullish Outlook
- AMZN Stock Under Pressure As Rivals Target Core Businesses
- HII Stock Climbs As Navy Contracts And Dividend Hike Fuel Momentum
- CIFR Stock Slides As Volatility Grips Cipher Mining
Valuation is where BBD stands out. The price-to-earnings ratio around 8.08 and price-to-book near 1.02 suggest the market is pricing Banco Bradesco Sa like a steady, not flashy, lender. The forward dividend yield is roughly 1.3%, modest but still a factor for some income-focused trading strategies. For active traders, the key takeaway is simple: BBD is cheap for a reason, and the chart must confirm any bounce before sizing up.
Why Traders Are Watching BBD’s Tight Trading Range
The recent tape on Banco Bradesco Sa reads like a slow bleed followed by a pause. BBD’s daily closes have slid from roughly $3.73 on 2026/07/22 to $3.21 on 2026/08/11. That is not a crash, but it is a clear, persistent pullback. For short-term traders, that kind of grind lower often sets up clean support and resistance levels.
Zoom in to the 5‑minute chart and you see BBD locked between about $3.21 and $3.24 for much of the session. Volume clusters around that band, and there are no big spikes or flushes. This is classic consolidation. The market is catching its breath after the recent slide, with neither buyers nor sellers willing to take full control. That kind of tight action is exactly where breakout and breakdown traders set alerts.
Under the hood, Banco Bradesco Sa carries a heavy balance sheet. Total assets sit around $2.33T, with deposits of roughly $1.15T and long‑term debt near $476.2B. The leverage ratio above 13 shows how much BBD leans on borrowed funds, standard for a big bank but still a reason many traders demand a discount. Price-to-book near 1 tells you the market is not paying a premium for that equity base.
Put it together and traders watching BBD see a value-priced bank, moderate profitability, and a chart that just tightened up after several red days. For day traders and swing traders, those conditions often lead to the next momentum push, up or down.
Conclusion
Banco Bradesco Sa sits at an interesting crossroads. BBD has already backed off from late‑July highs, and the stock now churns in a narrow band around $3.21–$3.24. That range gives traders clear lines in the sand. A strong push above the recent intraday highs would signal buyers finally stepping in. A clean break under $3.20 would confirm that the downtrend in BBD still has room to run.
On fundamentals, Banco Bradesco Sa looks like a textbook value bank: low P/E, price-to-book near 1, and a modest dividend. At the same time, the low return on equity and high leverage remind traders not to mistake “cheap” for “automatic bargain.” The balance sheet is massive, but the returns on that capital are not blowing anyone away right now. That tension is exactly what active traders try to exploit.
For traders in the Tim Sykes-style community, the playbook stays the same: let the chart prove itself. As Tim Sykes likes to say, “The market doesn’t care about your opinion, only your discipline.” That focus on discipline is echoed across many trading education circles; as Tim Bohen, lead trainer with StocksToTrade says, “I never chase price. The best opportunities allow me to enter on my terms, not when I’m feeling pressured.” With BBD, that means mapping the key levels, respecting the recent downtrend, and reacting to the next clear move out of this tight range—long or short—without hesitation and without marrying the stock. This article is for educational and research purposes only and is not investment advice.
This is stock news, not investment advice. StocksToTrade News delivers real-time stock market updates tailored to highlight the key catalysts driving short-term price movements. Our coverage is designed for active traders and investors who thrive in fast-moving markets, with a focus on volatile sectors like penny stocks, AI stocks, Robinhood stocks and other momentum plays. From earnings reports and FDA approvals to mergers, new contracts, and unusual trading volume, we break down the events that can spark significant price action.
Looking to level up your trading game? Explore StocksToTrade, the ultimate platform for traders. With powerful tools designed for swing and day trading, integrated news scanning, and even social media monitoring, StocksToTrade keeps you one step ahead.
Check out our quick startup guide for new traders!
- How to Read Stock Charts: A Guide for Beginners
- Trading Plan: 6 Steps to Create One
- How To Create a Stock Watchlist
Ready to build your watchlists? Check out these curated lists:
Once your watchlist is set, take the next step and trade with confidence using StocksToTrade’s robust platform. Don’t miss out — grab your 14-day trial for just $7 and experience the edge you need to thrive in today’s fast-paced markets.