
AXT Inc stocks have been trading down by -5.33 percent amid heightened concerns over its latest semiconductor demand outlook.
Key Takeaways
- AXTI has pulled back from early-October highs near the high $80s, but is holding the mid-$60s, signaling a cooling trend rather than a full breakdown.
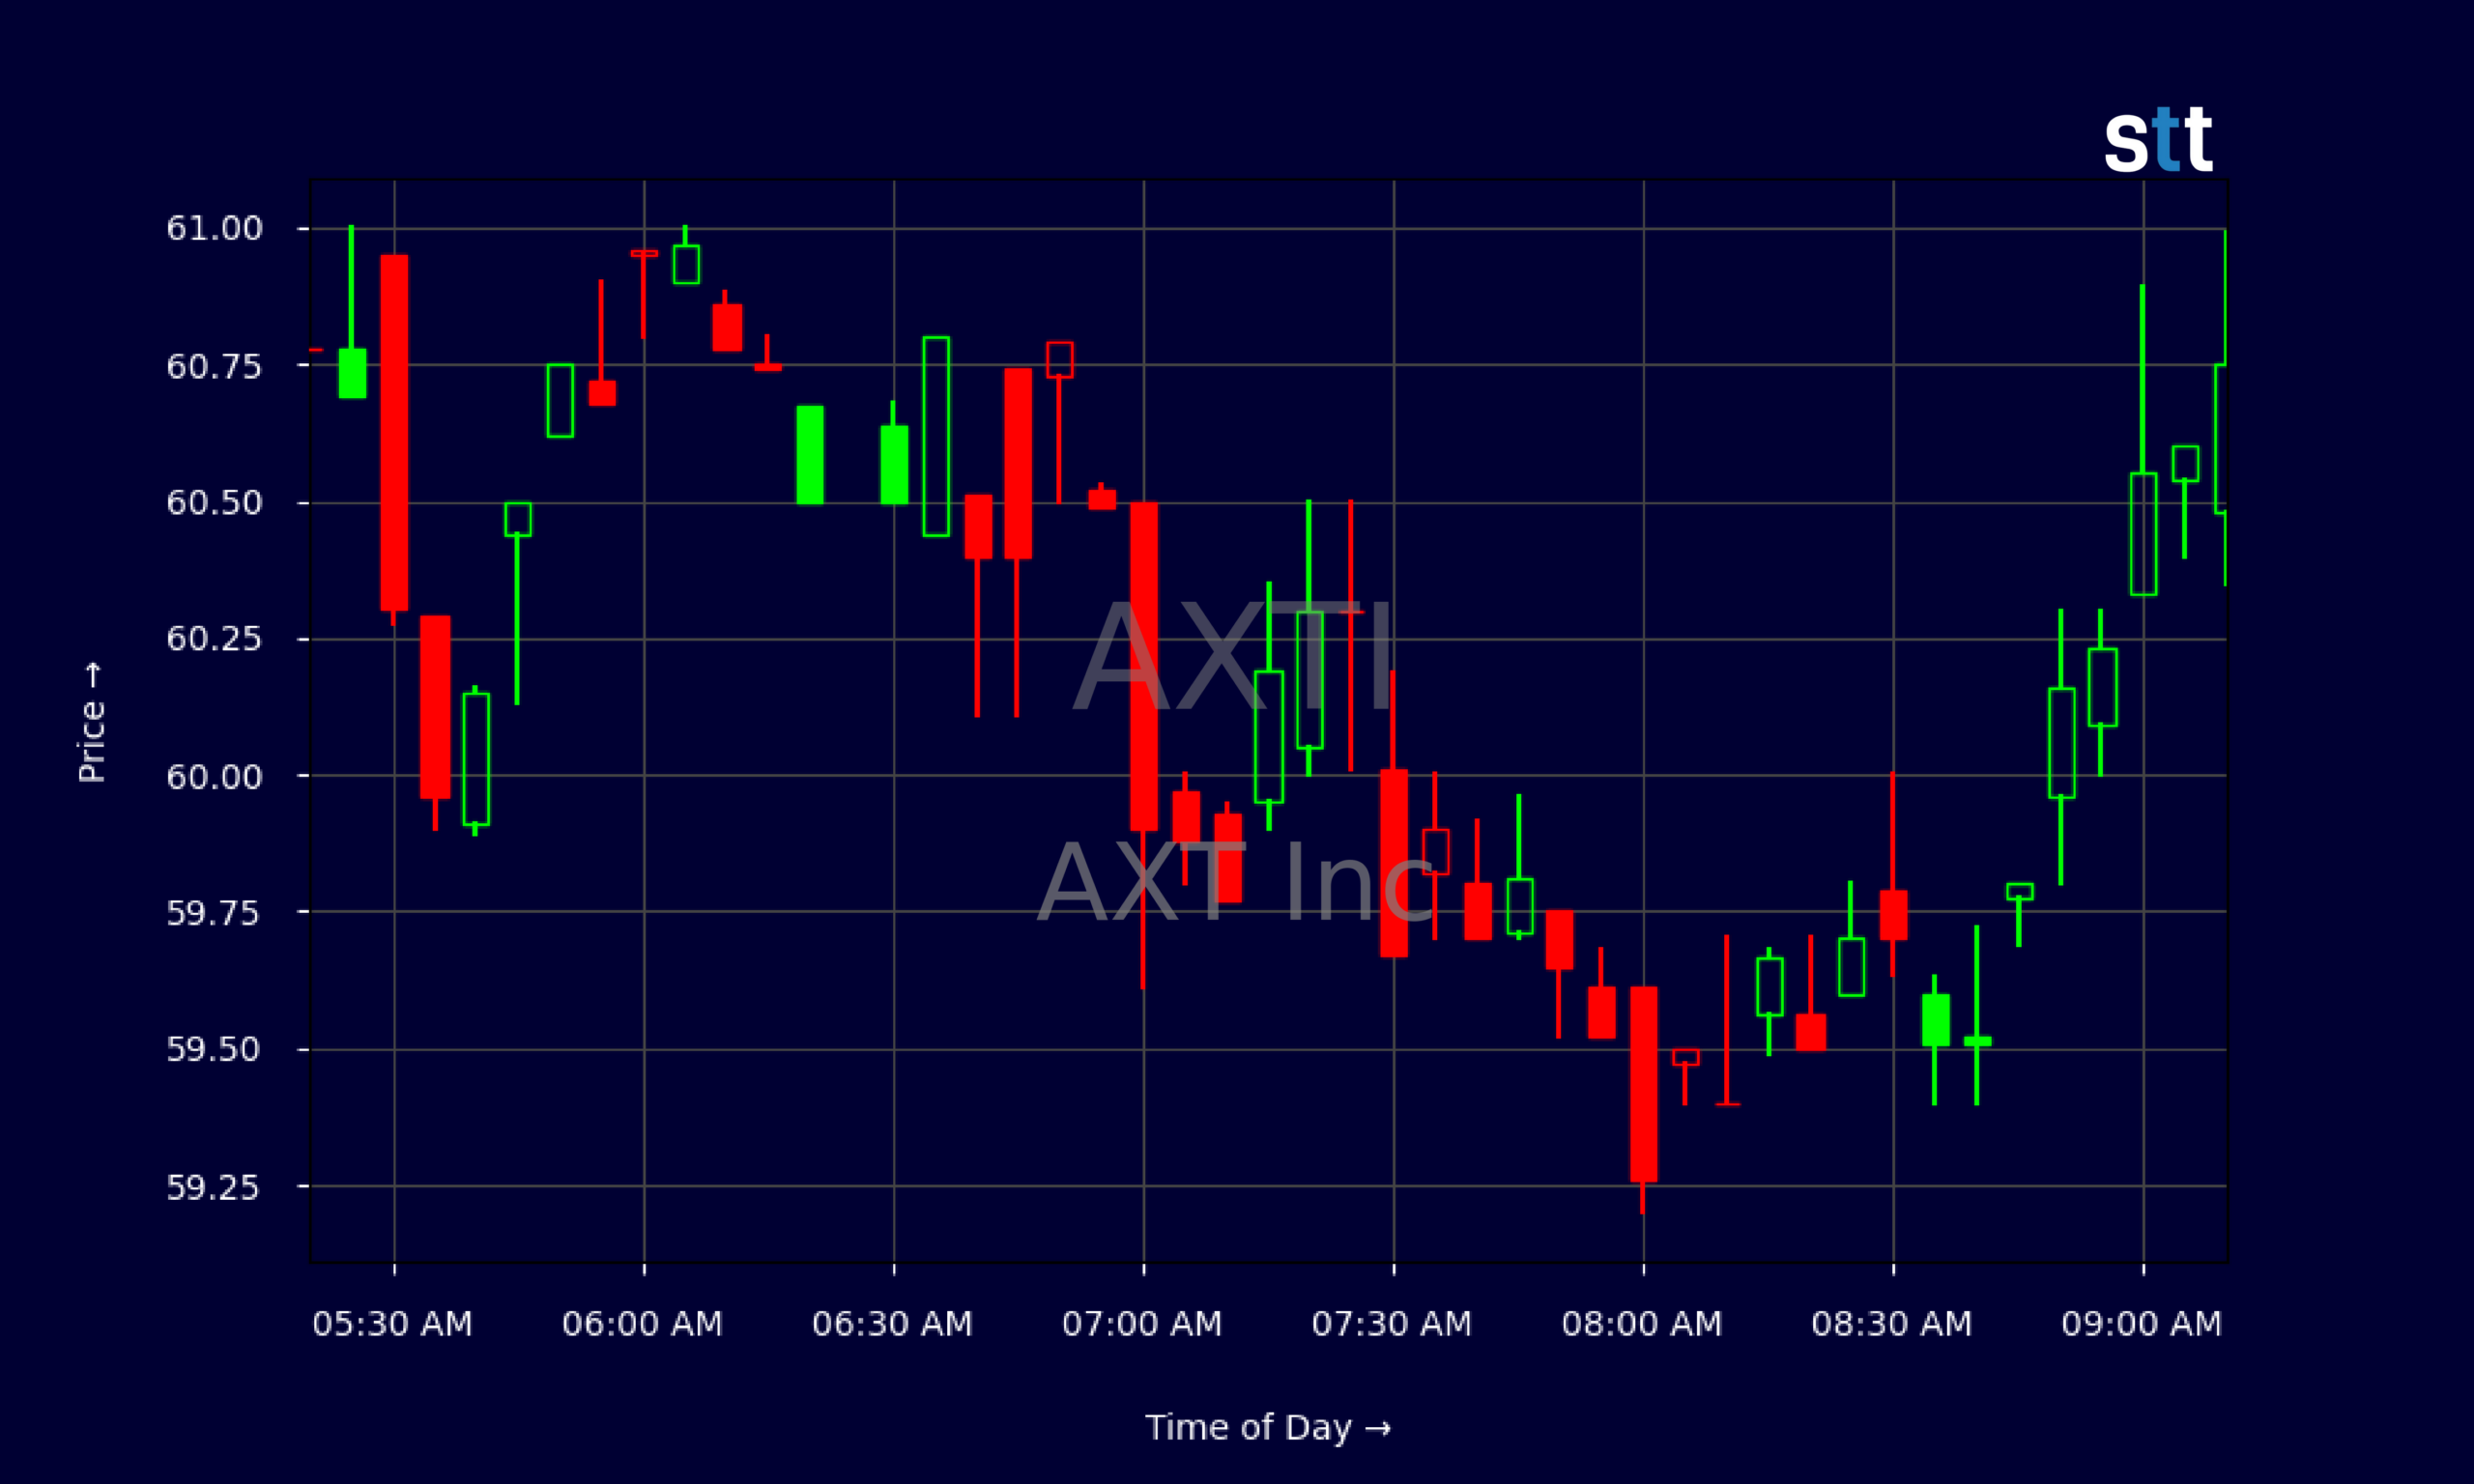
- The intraday AXTI chart shows tight trading around $60–$61, suggesting consolidation as traders wait for a fresh momentum push.
- AXT Inc’s balance sheet carries low debt and strong liquidity, giving traders confidence the company can ride out sector swings.
- AXTI’s rich valuation and thin profit margins mean any change in growth expectations can trigger sharp trading moves.
Live Update At 09:18:17 EDT: On Thursday, October 29, 2026 AXT Inc stock [NASDAQ: AXTI] is trending down by -5.33%! Discover the key drivers behind this movement as well as our expert analysis in the detailed breakdown below.
Quick Financial Overview
AXT Inc is a classic growth-style story with numbers that demand respect from traders. Revenue sits around $88.3M, but the market is pricing AXTI like a high‑expectation tech name. The price‑to‑sales ratio is about 35.8, and the price‑to‑book is roughly 5. That tells you one thing: traders are paying up for future potential, not current earnings.
Profitability is still light. AXTI runs with a gross margin near 32%, yet profit margins are only low single digits and return on assets is basically flat. The P/E ratio in the thousands is a red flag for anyone who only skims headlines; it mostly reflects tiny net earnings against a steep share price, not fat profits.
More Breaking News
- VALE Stock Slides As Wall Street Slashes Price Targets
- Vertiv Stock Rebounds As AI Factory Deals Deepen Nvidia Ties
- BBD Stock Slides As Analysts Slash Growth Outlook
- GOOGL Stock Slides As Earnings Miss Collides With Legal And Tax Heat
On the strength side, AXTI’s balance sheet is solid. Total debt to equity is only about 0.1, with a current ratio around 4.8 and a quick ratio near 3.6. That means AXT Inc has plenty of cash and near‑term assets to cover its bills. For active traders, that combination of high valuation, modest profits, and strong liquidity often sets up sharp trend moves when sentiment turns.
Why Traders Are Watching AXTI’s Price Action
Zooming out to the AXTI daily chart, the story is momentum cooling off. Earlier in the month, AXT Inc pushed into the mid‑ to high‑$80s, tagging highs around $87–$88 before fading. Since then, closes have slid into the $50s and $60s, with recent days bouncing from the low $50s to a close around $64.38. That’s a strong bounce off the dip, but still well under the peak — classic lower‑high behavior that momentum traders track closely.
The intraday five‑minute AXTI data confirms the shift from breakout mode to digestion. Most prints sit between $59 and $61, with repeated taps near $60 that get bought but not aggressively chased. That kind of tight range, after a big prior run, often signals a decision zone. Either AXT Inc builds a base here for another leg higher, or this turns into a distribution area before further downside.
Under the hood, AXTI’s latest quarterly numbers show why traders are willing to keep it on watch. AXT Inc generated about $47.6M in quarterly revenue, with operating income just over $10M and EBITDA around $17.6M. Free cash flow is positive, but small at roughly $3.6M. The company is clearly scaling, yet not at the point of thick, consistent profits.
For short‑term trading, this mix is powerful. AXTI has enough growth and balance‑sheet strength to attract dip buyers, but rich valuation and thin margins that can scare out weak hands fast. That’s the kind of tug‑of‑war that creates intraday spikes and washes — exactly what day traders look for.
Conclusion
AXTI sits at an important spot on the chart and in its fundamental story. After a run into the high $80s, AXT Inc has backed off into the $60s, where the stock is starting to coil. The five‑minute chart shows steady action around $60, hinting that traders are probing for a new equilibrium before the next strong move. When a name like AXTI shifts from vertical momentum to sideways trading, the patient traders start planning, not chasing.
Financially, AXT Inc brings a strong cash position, low leverage, and decent gross margins, but only modest bottom‑line results. The valuation ratios say AXTI is priced for growth, not safety. That means any fresh shift in sentiment — whether from broader semis trends, macro headlines, or technical breakdowns — can flip the switch from slow grind to fast move.
This is where the Tim Sykes style of discipline matters. As Tim says, “The market doesn’t care about your opinion, it cares about your preparation.” That preparation is rooted in process and review — as Tim Bohen, lead trainer with StocksToTrade says, “The best way to learn is by tracking trades, wins, losses, and lessons learned. Every trade has something to teach.” For AXTI, that preparation means knowing the key levels, respecting the volatility that comes with a high‑expectation name, and being ready to cut losses fast if the $60 area fails. For traders focused on education and research, AXTI is a live case study in how strong balance sheets, stretched valuations, and cooling momentum collide on the chart.
This is stock news, not investment advice. StocksToTrade News delivers real-time stock market updates tailored to highlight the key catalysts driving short-term price movements. Our coverage is designed for active traders and investors who thrive in fast-moving markets, with a focus on volatile sectors like penny stocks, AI stocks, Robinhood stocks and other momentum plays. From earnings reports and FDA approvals to mergers, new contracts, and unusual trading volume, we break down the events that can spark significant price action.
Looking to level up your trading game? Explore StocksToTrade, the ultimate platform for traders. With powerful tools designed for swing and day trading, integrated news scanning, and even social media monitoring, StocksToTrade keeps you one step ahead.
Check out our quick startup guide for new traders!
- How to Read Stock Charts: A Guide for Beginners
- Trading Plan: 6 Steps to Create One
- How To Create a Stock Watchlist
Ready to build your watchlists? Check out these curated lists:
Once your watchlist is set, take the next step and trade with confidence using StocksToTrade’s robust platform. Don’t miss out — grab your 14-day trial for just $7 and experience the edge you need to thrive in today’s fast-paced markets.