

Aurora Innovation Inc. stocks have been trading down by -11.69 percent after investor concerns over delayed autonomous trucking commercialization.
Key Takeaways
- AUR has faded from the mid-$5s to the mid-$4s, with recent trading showing a tight intraday range after early morning selling.
- Aurora Innovation Inc. is generating about $3.0M in quarterly revenue while posting heavy losses, signaling a classic high-risk growth profile.
- Cash and short-term investments near $1.0B give AUR meaningful runway despite a quarterly free-cash-flow loss of about $206M.
- Key ratios show steep negative margins and returns, so traders in AUR are betting on future execution, not current profitability.
- The daily chart shows AUR stuck in a short-term downtrend, and traders are watching for a decisive break above or below this range.
Live Update At 12:33:16 EDT: On Thursday, October 29, 2026 Aurora Innovation Inc. stock [NASDAQ: AUR] is trending down by -11.69%! Discover the key drivers behind this movement as well as our expert analysis in the detailed breakdown below.
Quick Financial Overview
Aurora Innovation Inc., trading as AUR, is a textbook example of a pre-revenue style tech story with real cash but big losses. Total quarterly revenue sits near $3.0M, a tiny number compared to the company’s roughly $2.0B asset base. That mismatch shows up in AUR’s brutal margins. Management is spending heavily now in hopes of future scale.
The income statement tells the story. AUR posted about -$234M in net income for the quarter on just $3.0M of sales. EBITDA was roughly -$221M. Research and development alone was about $203M, and general and administrative expense another $49M. For traders, that means Aurora Innovation Inc. is still deep in build-out mode rather than monetization mode.
More Breaking News
- EAT Stock Rallies As Wall Street Leans Bullish Into Earnings
- NUAI Stock Rattled As Fraud Lawsuit Targets AI Pivot Claims
- EAT Stock Draws Bullish Targets As Earnings Loom
- VALE Stock Slides As Wall Street Slashes Price Targets
On the balance sheet, AUR looks far healthier. Cash, cash equivalents, and short-term investments total around $1.0B, while total liabilities are only about $211M. Long-term debt is roughly $70M, with a total-debt-to-equity ratio near 0.04. A current ratio above 11 signals AUR has significant liquidity. The flip side is the negative free cash flow of about -$206M for the quarter, reminding traders that this runway is not unlimited.
Why Traders Are Watching AUR Price Action
AUR price action has shifted from hot to hesitant. Earlier in the month, Aurora Innovation Inc. was trading in the mid-$5s, printing highs up near $5.80. Now the stock is closing around $4.49, a clear pullback of roughly 20% from recent peaks. That drop alone gets day traders interested, because it often sets up either a bounce or a breakdown.
Look at the daily chart: AUR spent several sessions grinding between roughly $4.80 and $5.20, then slipped under that band. Each bounce toward $5.00 has been sold, signaling short-term control by sellers. For active traders, Aurora Innovation Inc. is now a range stock with defined levels. Rough support has formed near $4.40–$4.50, while resistance keeps showing up around $5.00–$5.20.
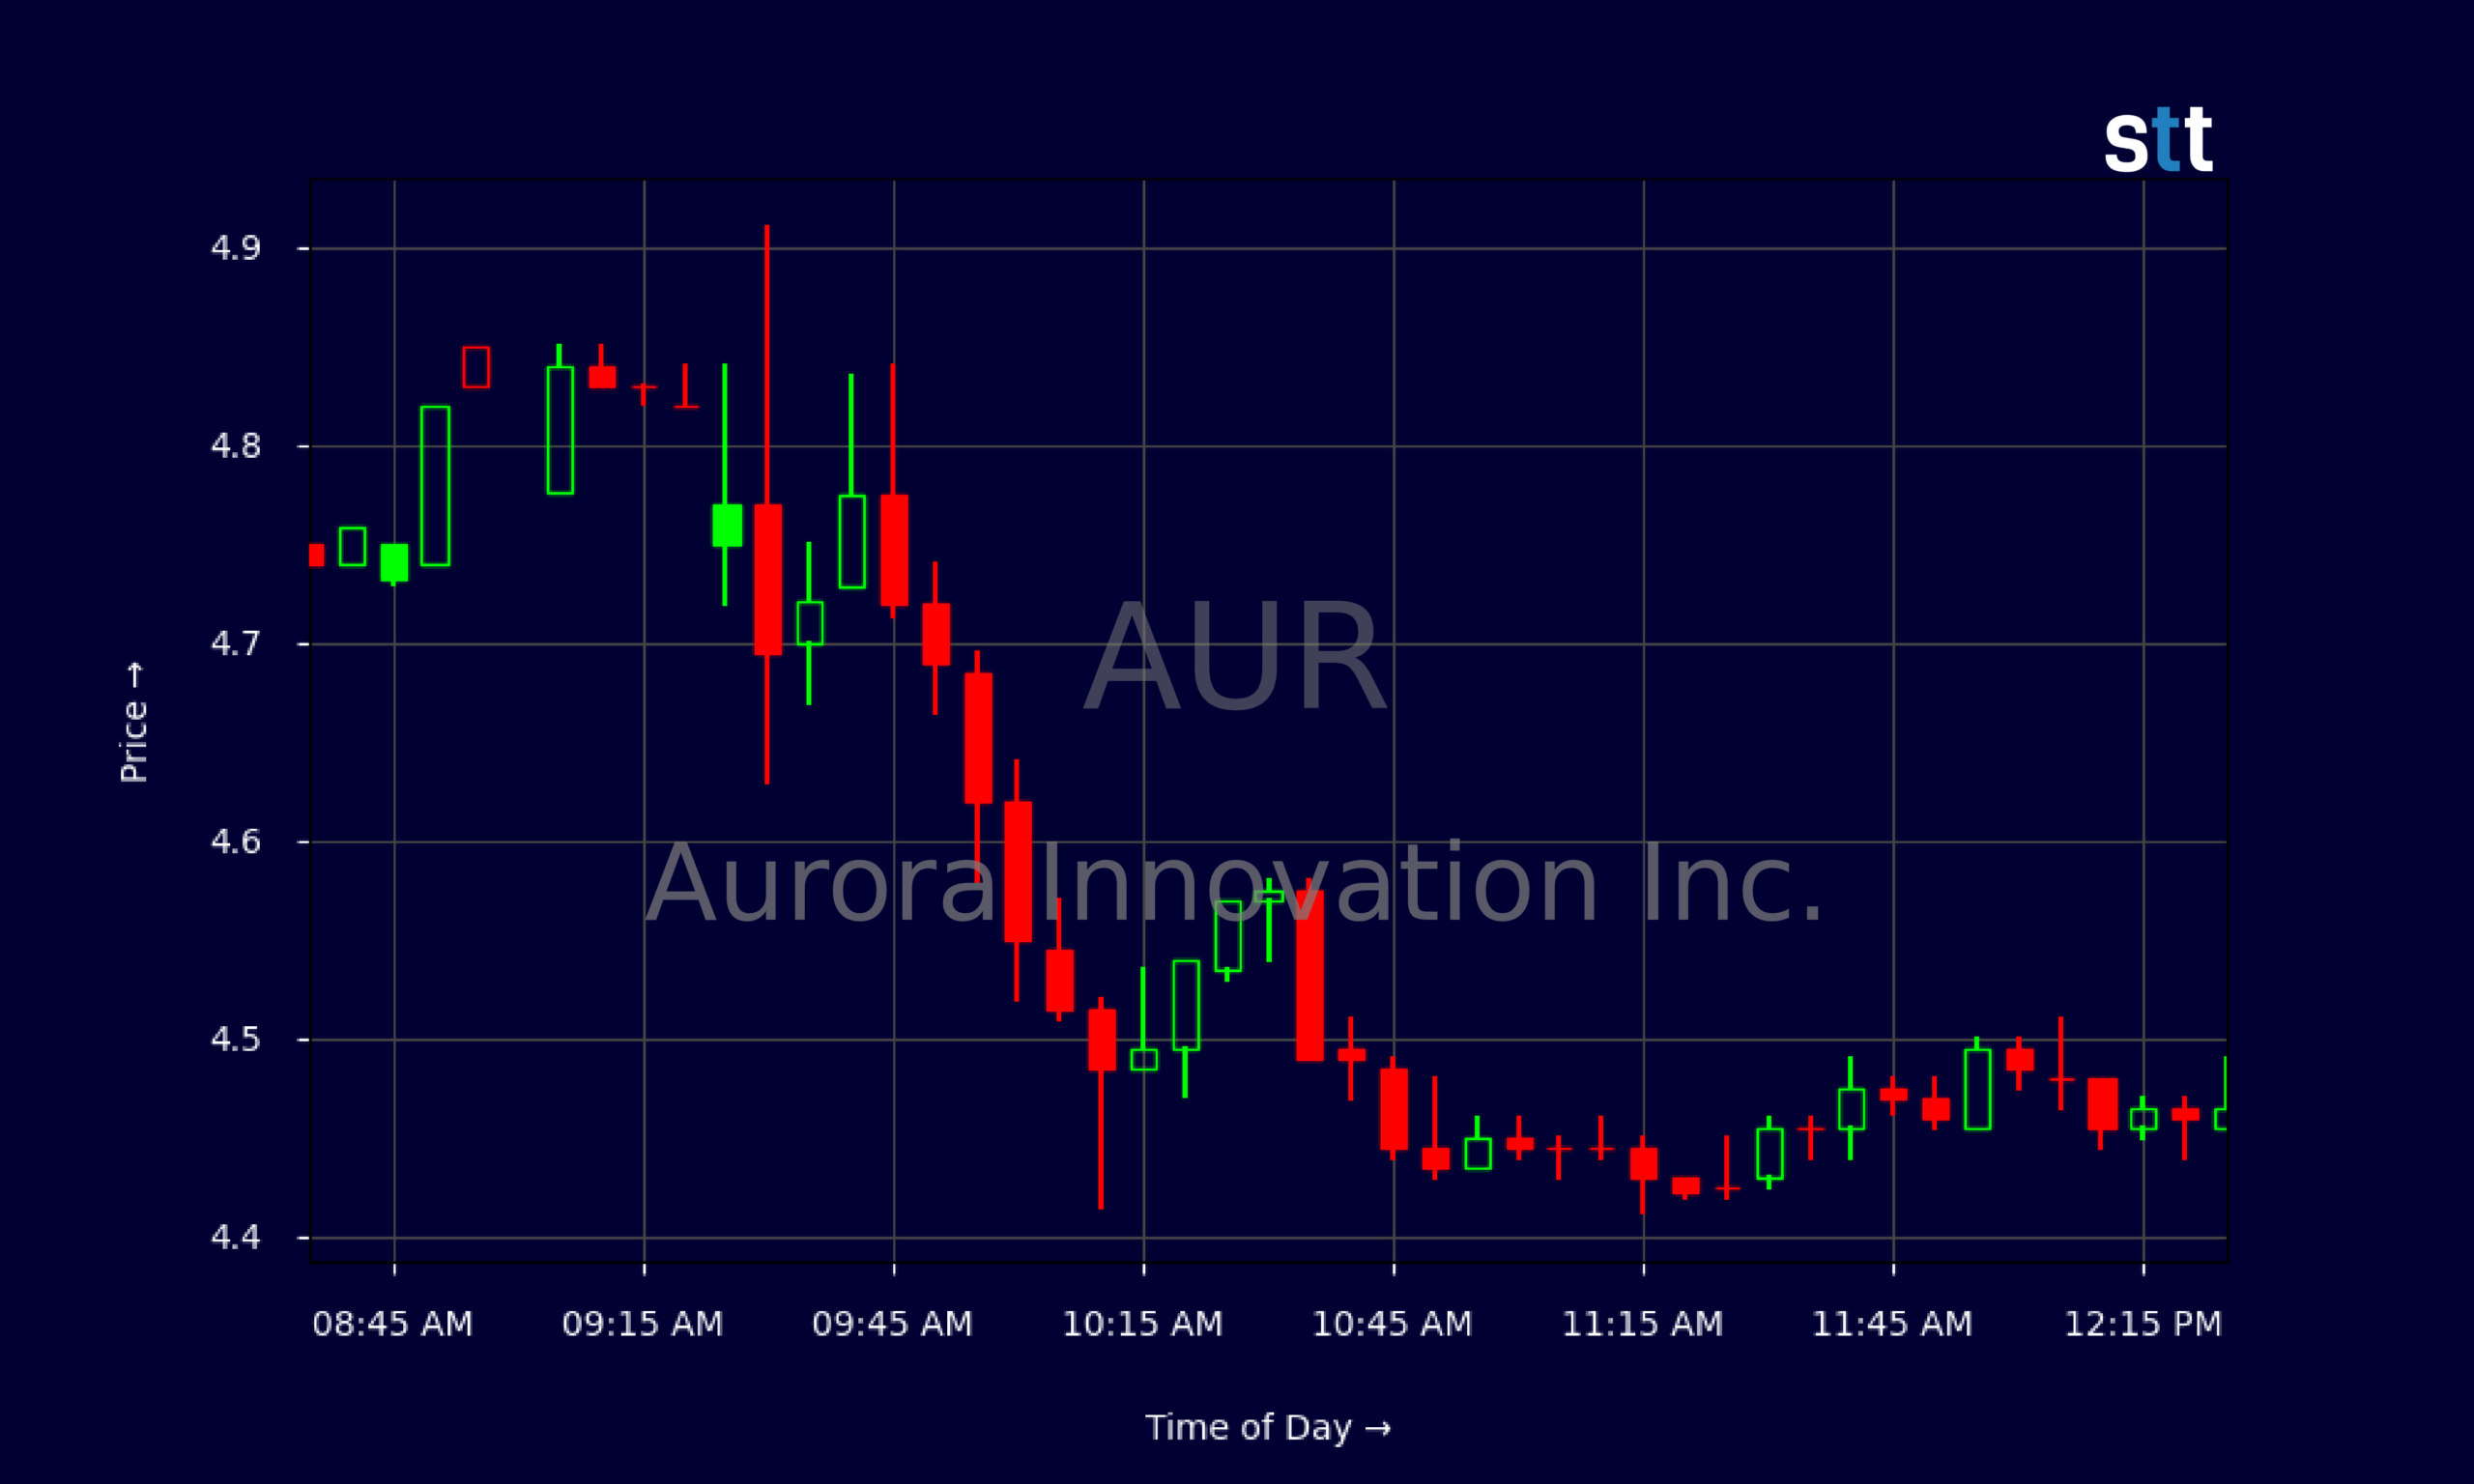
The intraday 5‑minute chart backs that up. AUR opened near $4.77 and quickly popped toward $4.91, then sold off steadily into the mid-$4.40s by midday. After that, price action flattened with tight candles between about $4.44 and $4.50. That’s classic morning momentum followed by lunchtime consolidation. Short-biased traders will read this as a failed morning push. Long-biased traders will see a possible higher-low base forming if AUR can hold above roughly $4.40.
Overlay that with the fundamentals and the story gets sharper. Aurora Innovation Inc. is burning over $170M in operating cash flow per quarter, but sits on large cash reserves and low debt. That combination often turns AUR into a sentiment-driven trading vehicle. When the market is excited about autonomous driving, the stock can squeeze hard. When focus shifts to cash burn and negative margins, AUR tends to fade. Traders who respect the range and react to the levels, not the hype, will navigate this better.
Conclusion
AUR is the kind of stock that rewards prepared traders and punishes lazy ones. Aurora Innovation Inc. pairs a sizable cash war chest with massive operating losses and almost no revenue. The balance sheet says “time to execute,” while the income statement still screams “early-stage science project.” That tension is what makes AUR such a volatile trading vehicle.
On the chart, Aurora Innovation Inc. has pulled back from the $5.70–$5.80 area into the mid-$4s, with clear intraday selling pressure followed by sideways action. For short-term traders, that means AUR is in a wait-and-see zone. A strong push back over $5.00 with volume would signal momentum returning. A clean break below $4.40 would confirm the sellers still own the tape. Until one of those happens, AUR sits in a choppy band that rewards tight risk management. As Tim Bohen, lead trainer with StocksToTrade says, “A good trade setup checks all the boxes—volume, trend, catalyst. Don’t trade if you’re missing pieces of the puzzle.” That checklist mindset is especially important with a volatile ticker like AUR, where partial setups often lead to frustrating chop instead of clean follow-through.
The key is to treat Aurora Innovation Inc. like any other speculative growth chart: track the trend, map the levels, and respect the cash burn. As Tim Sykes likes to say, “Discipline is the only edge that never goes away.” Traders studying AUR’s numbers and price action through that lens will be better positioned to react when the next big move shows up. This analysis is for educational and research purposes only and is not investment advice.
This is stock news, not investment advice. StocksToTrade News delivers real-time stock market updates tailored to highlight the key catalysts driving short-term price movements. Our coverage is designed for active traders and investors who thrive in fast-moving markets, with a focus on volatile sectors like penny stocks, AI stocks, Robinhood stocks and other momentum plays. From earnings reports and FDA approvals to mergers, new contracts, and unusual trading volume, we break down the events that can spark significant price action.
Looking to level up your trading game? Explore StocksToTrade, the ultimate platform for traders. With powerful tools designed for swing and day trading, integrated news scanning, and even social media monitoring, StocksToTrade keeps you one step ahead.
Check out our quick startup guide for new traders!
- How to Read Stock Charts: A Guide for Beginners
- Trading Plan: 6 Steps to Create One
- How To Create a Stock Watchlist
Ready to build your watchlists? Check out these curated lists:
Once your watchlist is set, take the next step and trade with confidence using StocksToTrade’s robust platform. Don’t miss out — grab your 14-day trial for just $7 and experience the edge you need to thrive in today’s fast-paced markets.