

Amplitude Inc. stocks have been trading up by 14.24 percent amid bullish sentiment on its latest product and growth outlook.
Market Insights For AMPL Traders
- Q1 revenue came in at $93.5M versus $92.95M expected, with adjusted EPS at -$0.02, as Amplitude Inc. pushed an AI-driven “agentic analytics” narrative.
- Q2 guidance calls for a small loss of $0.01–$0.02 per share and revenue of $96.9M–$99.1M, slightly ahead of Street expectations.
- Baird cut its AMPL price target to $10 from $12 but kept an Outperform rating, citing margin pressure as a key overhang.
- UBS reduced its target to $8.50 from $10 while reiterating a Buy, saying near-term performance lags but the longer-term build-out looks stronger.
- Management will present at Needham and D.A. Davidson conferences, reinforcing Amplitude Inc.’s AI analytics positioning and its 4,900+ customer base.
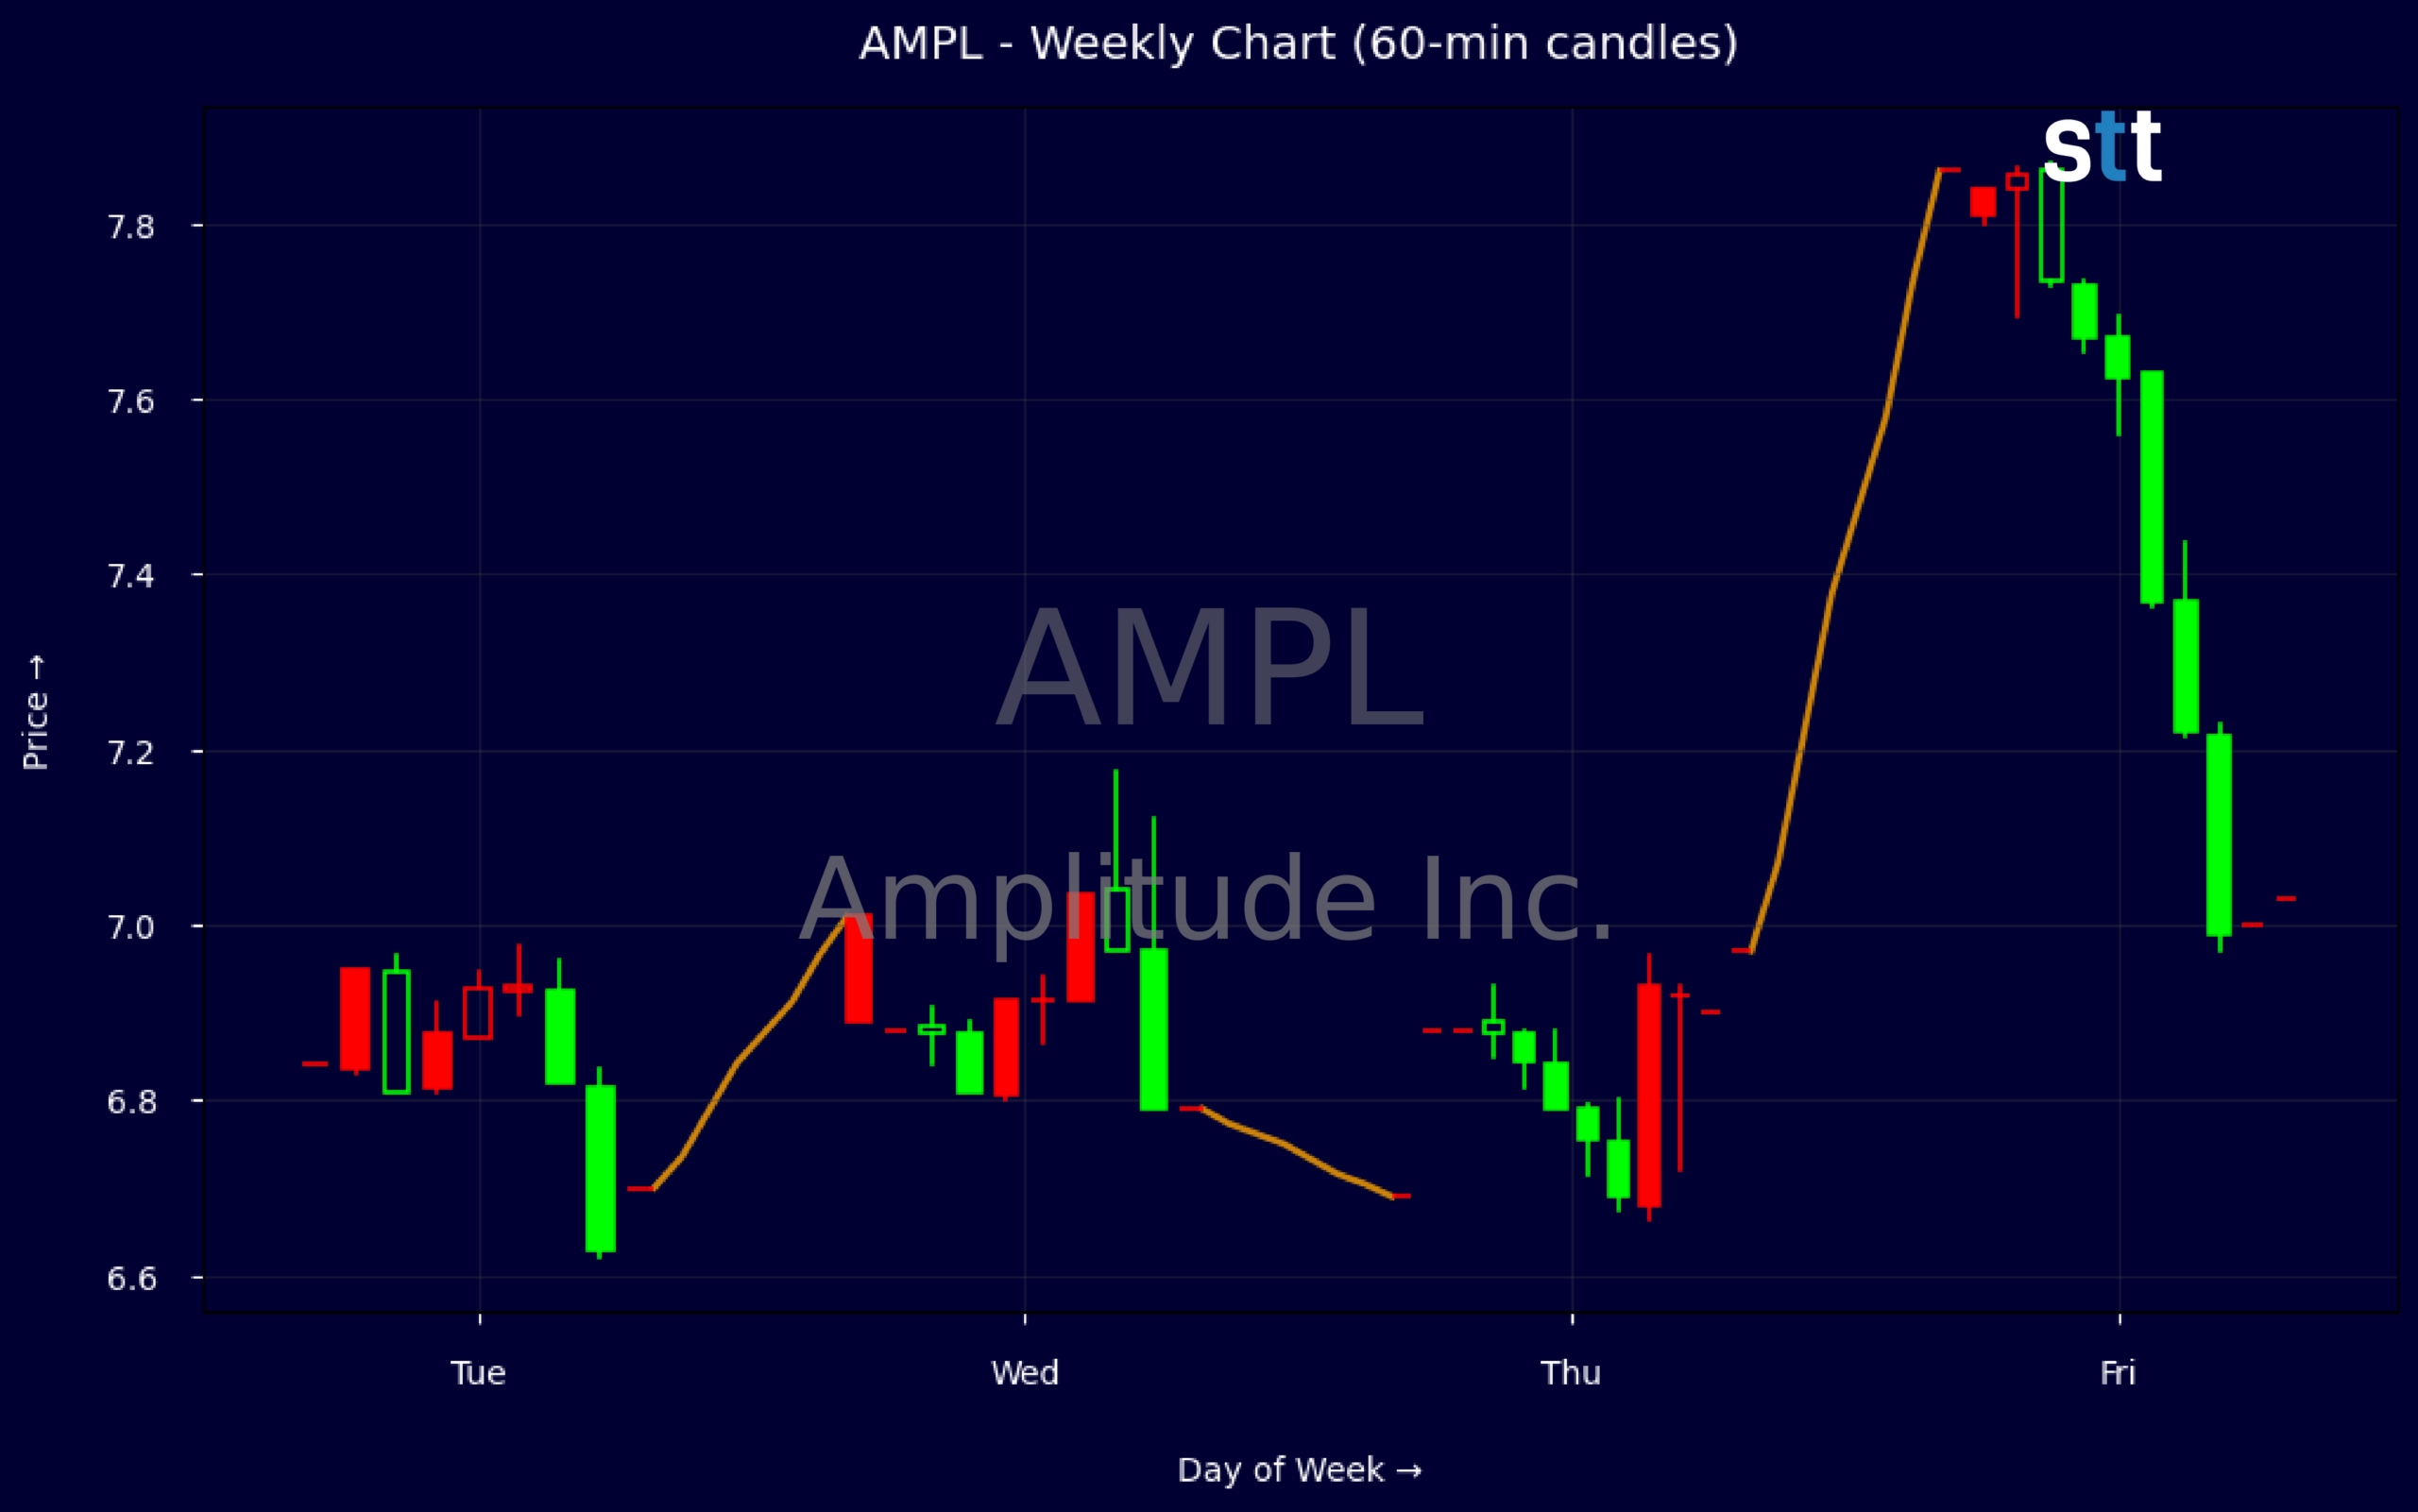
Weekly Update May 25 – May 29, 2026: On Sunday, May 31, 2026 Amplitude Inc. stock [NASDAQ: AMPL] is trending up by 14.24%! Discover the key drivers behind this movement as well as our expert analysis in the detailed breakdown below.
Technology industry expert:
Analyst sentiment – positive
Amplitude (AMPL) is a subscale but well‑positioned digital analytics vendor, with $93.5M Q1 revenue and high 73.6% gross margin, offset by deeply negative EBIT margin (~‑25%) and ROE (~‑35%). Revenue CAGR remains solid but decelerating, while net losses persist at ~‑25% margin despite substantial stock‑based comp. The balance sheet is strong: minimal leverage (debt/equity ~0.03), ample liquidity (current ratio 1.5, ~$182M cash and investments), and positive working capital, giving several years of runway to reach sustainable profitability.
Technically, AMPL is in a fragile basing phase after a sharp bounce: the weekly tape shows a jump from $6.68 to $7.86, reclaiming prior breakdown levels on expanding participation, with recent intraday 5‑minute candles showing orderly consolidation rather than distribution. The dominant short‑term trend is up, but within a broader sideways range. The actionable level is $7.20–7.30: above it, longs can target $8.50 with stops near $6.60; a decisive break below $6.60 invalidates the bull setup.
More Breaking News
- BBAI Stock Pops As BigBear.ai Lands $225M In Federal AI Deals
- JDZG Stock Plunges As Volatility Grips Thinly Traded Name
- REGN Stock Climbs As Libtayo Data And Targets Rise
- Micron Stock Slides As China’s CXMT DRAM Threat Rattles Traders
Near‑term catalysts center on execution of the AI‑driven “agentic analytics” roadmap, incremental investor exposure via conferences, and successive revenue beats versus modest guidance. Street sentiment is still constructive (Overweight/Buy with ~$10–10.65 average target) despite margin worries and recent target cuts. Versus Technology and Software & IT Services peers, AMPL trades at a moderate ~2.9x sales with inferior profitability but better balance‑sheet safety. Risk‑reward is favorable: accumulate with a 12‑month target of $9–10 and key support at $6.50.
Quick Financial Overview
Amplitude Inc. is still in loss-making mode, but the top line continues to grind higher. Q1 2026 revenue of $93.5M slightly beat expectations, and guidance of $96.9M–$99.1M for Q2 signals steady, if unspectacular, growth. With trailing revenue around $343.2M and a price-to-sales multiple of 2.91, AMPL trades in a mid-range SaaS valuation zone where execution and narrative matter as much as raw numbers.
Profitability remains the core problem. The latest quarter showed an EBITDA loss of about $19.4M and an operating loss near $24.1M, consistent with negative EBIT margins around -25%. Despite a strong 73.6% gross margin, heavy sales and marketing plus R&D spend keep profit margins deep in the red and returns on equity and assets solidly negative. Analysts at Baird and UBS both trimmed price targets, explicitly pointing to margin risk even as they maintained positive ratings.
The balance sheet gives AMPL room to work. Cash and short-term investments near $181.9M, with long-term debt of only about $6.6M, mean low financial stress and a current ratio of 1.5. Free cash flow for the recent quarter was around -$13.2M, but stock-based compensation and non-cash items cushion the cash burn. On the tape, weekly candles show a quick push from roughly $6.68 to $7.86 into late May 2026, while the intraday 5-minute bar with a $7.02 open and $7.87 high confirms an aggressive upside spike that short-term traders should treat as a momentum move, not a trend by itself.
Conclusion
This is stock news, not investment advice. StocksToTrade News delivers real-time stock market updates tailored to highlight the key catalysts driving short-term price movements. Our coverage is designed for active traders and investors who thrive in fast-moving markets, with a focus on volatile sectors like penny stocks, AI stocks, Robinhood stocks and other momentum plays. From earnings reports and FDA approvals to mergers, new contracts, and unusual trading volume, we break down the events that can spark significant price action.
Looking to level up your trading game? Explore StocksToTrade, the ultimate platform for traders. With powerful tools designed for swing and day trading, integrated news scanning, and even social media monitoring, StocksToTrade keeps you one step ahead.
Check out our quick startup guide for new traders!
- How to Read Stock Charts: A Guide for Beginners
- Trading Plan: 6 Steps to Create One
- How To Create a Stock Watchlist
Ready to build your watchlists? Check out these curated lists:
Once your watchlist is set, take the next step and trade with confidence using StocksToTrade’s robust platform. Don’t miss out — grab your 14-day trial for just $7 and experience the edge you need to thrive in today’s fast-paced markets.