
American Airlines Group Inc. stocks have been trading down by -4.05 percent after weak travel demand headlines pressured investor sentiment.
Click Here for a Millionaire's POV on Trading AAL
SUBSCRIBE FOR ALERTSJOIN 50,000+ ACTIVE TRADERS
Key Takeaways Traders Need To Know
- Q3 brought a wider adjusted loss for American Airlines but AAL still beat Wall Street on both revenue and loss per share.
- Management guided Q4 adjusted EPS to a deeper loss of $1.10 to $0.50, even as it projects revenue growth near 20% and only modest cost and capacity increases.
- Full-year 2026 adjusted EPS guidance was slashed to a loss of $1.60–$1.00, far worse than prior targets and below consensus expectations.
- AAL now expects 2026 fuel expense to be more than $7B above 2025, a sharp hit to margins and earnings power.
- Leadership warned that 2027 growth will “decelerate considerably” and that profitability is under pressure across all carriers, underscoring broad sector margin stress.
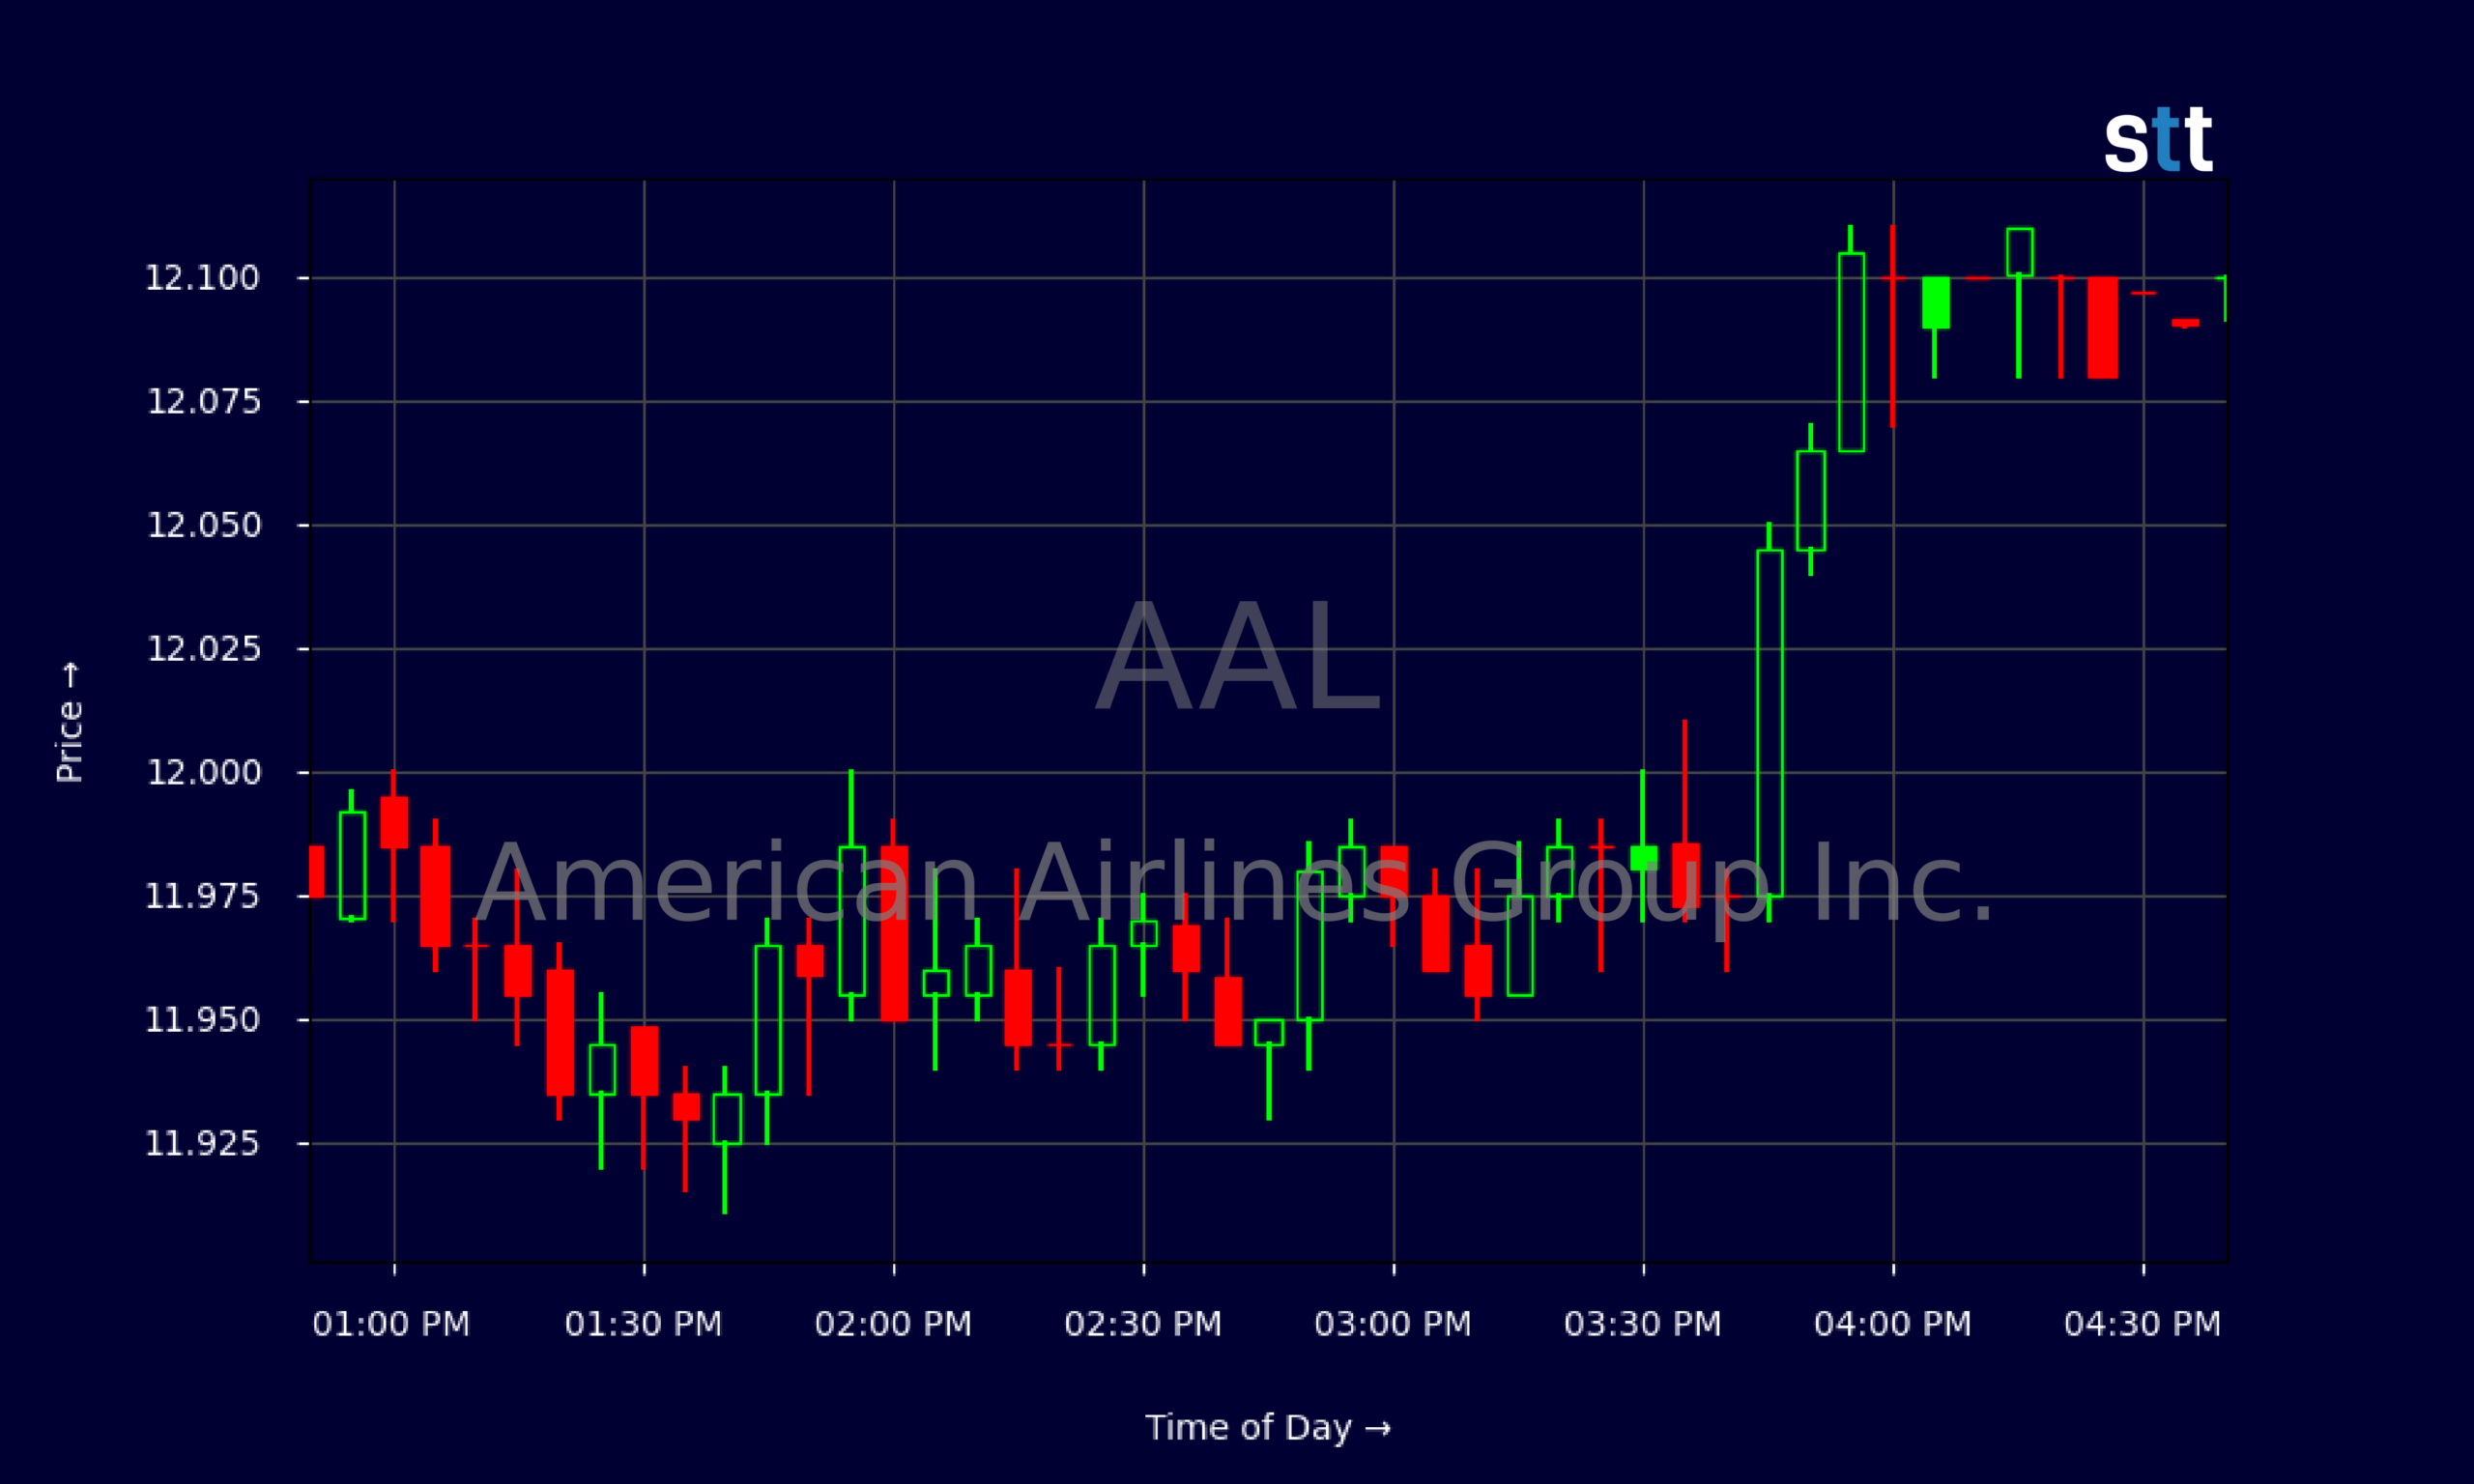
Live Update At 16:46:55 EDT: On Friday, October 23, 2026 American Airlines Group Inc. stock [NASDAQ: AAL] is trending down by -4.05%! Discover the key drivers behind this movement as well as our expert analysis in the detailed breakdown below.
Quick Financial Overview
AAL has been trading like a slow bleed on the daily chart. Since late September, American Airlines stock has slipped from the $13.50 area to around $12.10, a steady downtrend rather than a crash. Each bounce toward $13 has faded, telling traders that sellers still control the tape.
Intra-day, AAL shows the same story. The 5‑minute chart on the latest session opened near $12.29, tested $12.30, then leaked lower for most of the day before stabilizing just above $12.10 into the close. That intraday fade off the open is classic supply hitting strength.
Fundamentals back up that weak price action. American Airlines generated about $16.3B in Q3 revenue and a small $115M operating profit, but still printed a net loss of $269M, or -$0.41 per share. Margins are thin: EBIT margin near 2.2% and negative net margin around -0.6%. Leverage is heavy, with roughly $31.6B of long‑term debt and negative equity on the balance sheet.
More Breaking News
- BKYI Stock Rockets On Middle East Deals And FIDO Milestone
- SLB Stock Climbs As New Mega Contracts Power Momentum
- Cleveland-Cliffs Stock Jumps As Earnings Beat Fuels 2027 Hype
- CBRG ETF Slides From Highs As Volatility Grips Traders
For traders, that mix of high debt, thin margins, and persistent losses means every move in oil and every guidance tweak can swing AAL hard. The chart is telling you the market does not trust the earnings power yet.
Why Traders Are Watching AAL After The Guidance Reset
American Airlines is back in the spotlight because management just reset expectations in a big way. AAL beat Q3 revenue and EPS estimates, but the stock still dropped roughly 4% in premarket trading once traders saw the new outlook. That price reaction tells you where the focus is: not on past numbers, but on forward profits.
Here’s the core issue. AAL guided Q4 adjusted EPS to a loss between $1.10 and $0.50. Street consensus was looking for only a $0.41 loss. At the same time, American Airlines expects Q4 revenue to grow almost 20% or more, with only modest capacity and cost increases. When you grow revenue that fast and still lose more money than expected, the market reads that as broken operating leverage.
The 2026 story is even tougher. AAL now forecasts an adjusted loss of $1.60–$1.00 per share for 2026, versus Wall Street’s prior expectation for a smaller loss and versus its own earlier range that stretched up to positive territory. Management pinned this mainly on fuel, warning that 2026 fuel expense will run over $7B higher than 2025.
That is a massive headwind. American Airlines also told traders that profitability is under pressure across the airline sector and that its growth rate in 2027 will slow “considerably.” UBS widened its projected Q4 loss for AAL and trimmed its price target, while still holding a Buy rating, but the tone is clear: AAL’s earnings profile now looks more vulnerable than peers. For short‑term traders, that vulnerability and volatility are exactly why AAL stays on the watchlist.
Conclusion
For active traders, the new American Airlines setup is all about balancing strong demand against a brutal cost curve. AAL is proving it can bring in revenue — Q3 sales were solid and guidance calls for nearly 20%‑plus growth in Q4 — but the company’s own numbers say that fuel and other costs are outrunning that growth. When a management team tells you 2026 fuel will be more than $7B higher than 2025 and that 2027 growth will cool hard, you listen.
On the chart, AAL is already pricing in a lot of that stress. The steady drift from the mid‑$13s down toward $12, plus the immediate 4% premarket hit on the guidance cut, shows how fast sentiment can shift when forward EPS gets marked lower. At the same time, sector-wide pressure means AAL trades as much on oil headlines and macro commentary as on its own execution.
This is where trading mindset matters. American Airlines is a highly leveraged, thin‑margin name in a volatile industry. That combination can create sharp, tradeable moves both ways, especially around earnings and guidance updates. As Tim Bohen, lead trainer with StocksToTrade says, “A good trade setup checks all the boxes—volume, trend, catalyst. Don’t trade if you’re missing pieces of the puzzle.” That’s especially relevant here, because AAL’s rising cost profile and sector volatility mean traders need every key element of a setup aligned before taking a position. As Tim Sykes likes to say, “The market doesn’t care about your opinion, it cares about the numbers and the price action — respect both, and always cut losses quickly.” For AAL, those numbers now scream caution, and the price action is backing them up.
This is stock news, not investment advice. StocksToTrade News delivers real-time stock market updates tailored to highlight the key catalysts driving short-term price movements. Our coverage is designed for active traders and investors who thrive in fast-moving markets, with a focus on volatile sectors like penny stocks, AI stocks, Robinhood stocks and other momentum plays. From earnings reports and FDA approvals to mergers, new contracts, and unusual trading volume, we break down the events that can spark significant price action.
Looking to level up your trading game? Explore StocksToTrade, the ultimate platform for traders. With powerful tools designed for swing and day trading, integrated news scanning, and even social media monitoring, StocksToTrade keeps you one step ahead.
Check out our quick startup guide for new traders!
- How to Read Stock Charts: A Guide for Beginners
- Trading Plan: 6 Steps to Create One
- How To Create a Stock Watchlist
Ready to build your watchlists? Check out these curated lists:
Once your watchlist is set, take the next step and trade with confidence using StocksToTrade’s robust platform. Don’t miss out — grab your 14-day trial for just $7 and experience the edge you need to thrive in today’s fast-paced markets.