
Alpha Modus Holdings Inc. shares rallied as investors reacted to its most impactful AI-driven fintech developments; stocks have been trading up by 51.9 percent.
Click Here for a Millionaire's POV on Trading AMOD
SUBSCRIBE FOR ALERTSJOIN 50,000+ ACTIVE TRADERS
Key Takeaways
- AMOD has dropped from a $5.22 high to sub-$1.50 in weeks, showing extreme volatility that short-term traders track closely.
- Recent intraday action in Alpha Modus Holdings Inc. shows a sharp morning ramp from around $1.30 to near $1.98, then consolidation.
- The latest report shows negative equity and heavy current debt, putting AMOD firmly in high-risk territory despite over $2.00M in cash.
- Revenue for AMOD remains tiny relative to its market aspirations, while losses and cash burn remain significant.
- Active trading in AMOD centers on technical levels and momentum, not on fundamental strength, making discipline critical.
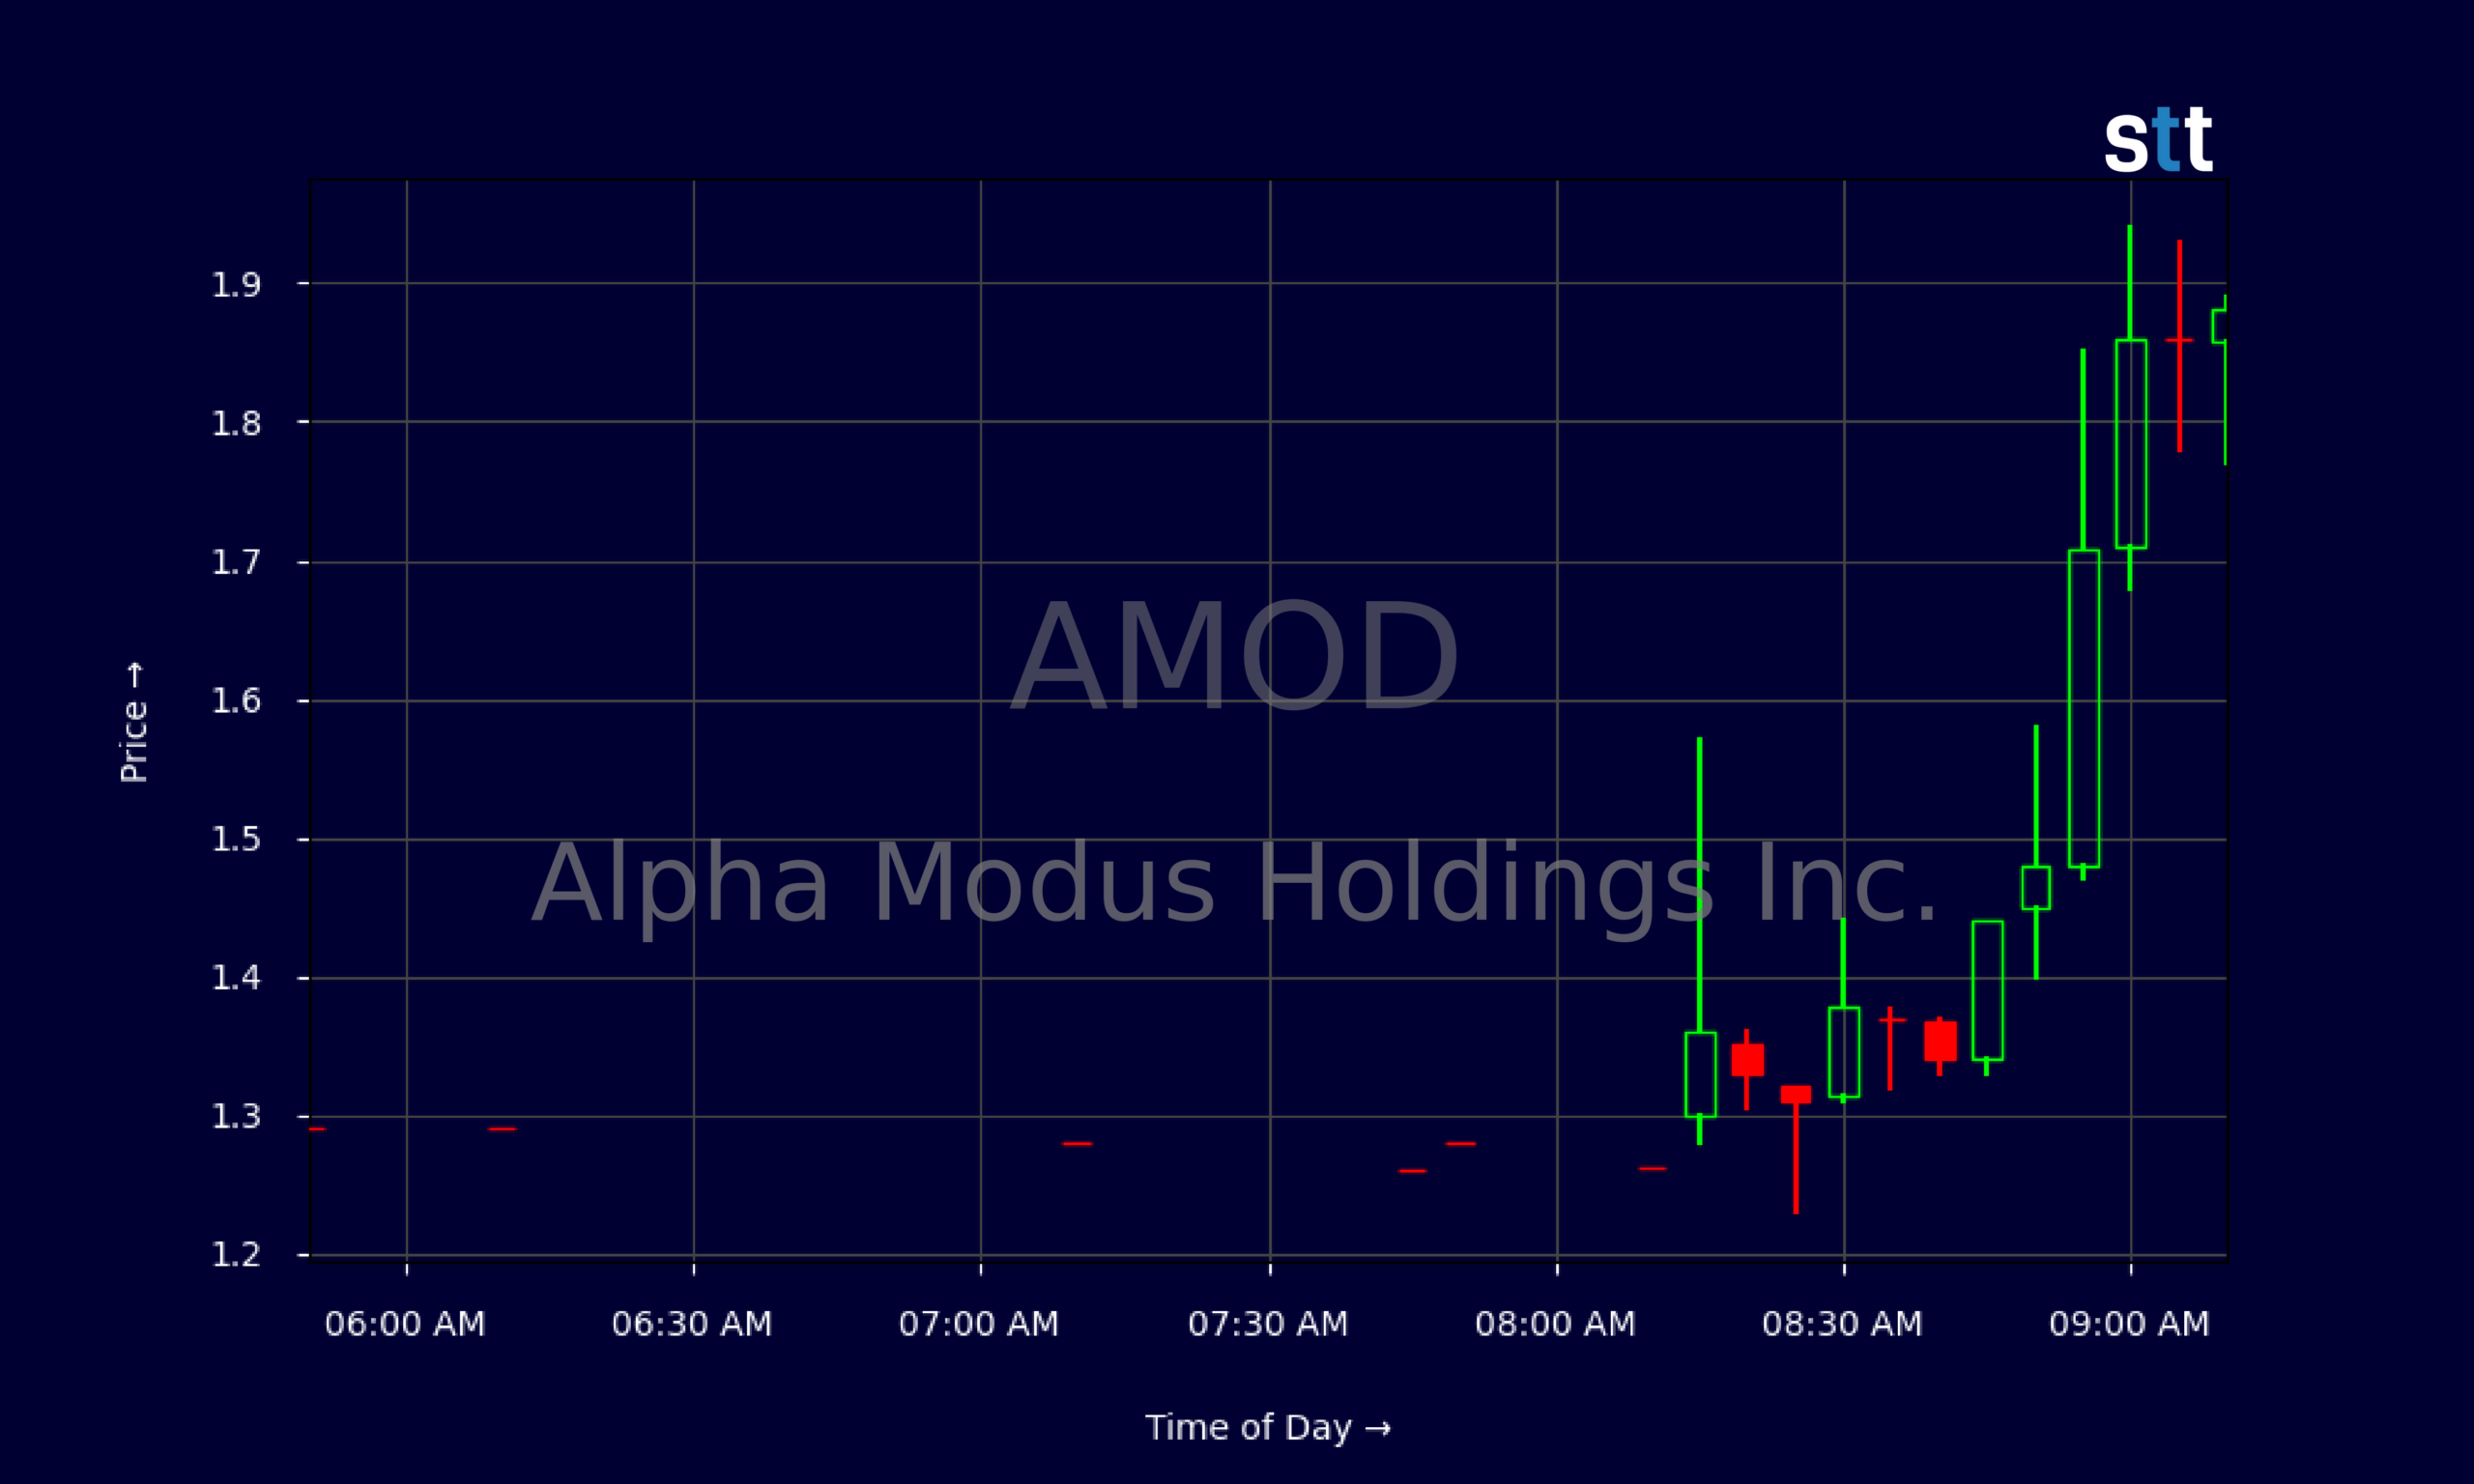
Live Update At 09:17:46 EDT: On Wednesday, October 21, 2026 Alpha Modus Holdings Inc. stock [NASDAQ: AMOD] is trending up by 51.9%! Discover the key drivers behind this movement as well as our expert analysis in the detailed breakdown below.
Quick Financial Overview
Alpha Modus Holdings Inc., trading under ticker AMOD, sits in classic speculative micro-cap territory. The company reported revenue of just $7,138, a tiny number that tells traders AMOD is still more story than business at this stage. At the same time, AMOD posted a net loss of roughly $2.15M, with negative earnings per share of about -$1.02 on a very small base of average shares.
On the balance sheet, AMOD shows about $2.00M in cash, but current liabilities of roughly $9.54M and current debt around $6.24M. That leaves Alpha Modus Holdings Inc. with negative working capital of more than $6.25M and stockholders’ equity deep in the red at about -$6.13M. For traders, that screams financial stress.
More Breaking News
- HTZ Stock Slips As Hertz Bets Big On TestDrive+ Expansion
- AIXI Stock Whipsaws As Traders Chase AI Volatility
- SPHL Stock Slides Premarket After Sharp 36% Rally
- SPCX Stock Rallies As Starlink Mobile And AI Ambitions Scale Up
Key ratios underline the point. AMOD’s current ratio near 0.3 and quick ratio around 0.2 show a company that may struggle to cover near-term obligations without more financing. Return on assets is sharply negative, reflecting that AMOD is not yet turning its limited assets into profits. In simple terms, Alpha Modus Holdings Inc. is a high-risk, dilution-prone story stock where trading hinges more on price action than on fundamentals.
Why Traders Are Watching AMOD’s Wild Price Swings
What pulls active traders toward AMOD right now is not a strong balance sheet or booming revenue. It’s the chart. Alpha Modus Holdings Inc. has printed a textbook high-flyer-then-collapse pattern that momentum traders study constantly.
In early October, AMOD ripped from around $1.50 on 2026/10/01 to intraday highs above $5.00 on 2026/10/05. That kind of move — more than tripling in a few sessions — is what short-term trading dreams are made of. But the next chapters matter just as much. From that $5.22 high, AMOD bled steadily lower, closing recently around $1.29–$1.30. That’s a brutal retrace and a clear warning about chasing strength late.
Zoom into the intraday tape, and Alpha Modus Holdings Inc. shows the same story in fast-forward. Pre-market trading started in the low $1.30s, then AMOD ramped hard to just under $2.00 by 09:16. This kind of early surge, followed by sideways consolidation, is a classic pattern in thin, speculative names: big gap, emotional chase, then a battle between late longs and profit-takers.
For day traders, AMOD’s range — from roughly $1.30 lows to near $1.98 highs in a single morning — offers opportunity, but only with tight risk control. Liquidity can dry up quickly in Alpha Modus Holdings Inc., spreads can widen, and one bad entry can trap a trader for days. The stock’s violent swings and low price keep it on many watchlists, but the same traits make discipline non‑negotiable.
Conclusion
AMOD is a textbook example of a speculative micro-cap that trades far more on emotion and momentum than on underlying business strength. Alpha Modus Holdings Inc. has minimal revenue, persistent losses, and a balance sheet with negative equity and heavy short-term obligations. Those numbers tell traders that dilution, debt deals, and financing overhangs remain very real risks.
At the same time, the chart for AMOD still grabs attention. The move from $1s to above $5 and back toward the $1s again shows how unforgiving these plays can be. Intraday, Alpha Modus Holdings Inc. continues to offer sharp spikes and fast drops, ideal for experienced traders who know how to size small and cut quickly.
For newer traders studying AMOD, the lesson is clear: focus on risk first. Respect the volatility, recognize the weak fundamentals, and treat every trade as a tactical move, not a long-term bet. As Tim Sykes loves to remind his students, “Cut losses quickly — that’s rule number one.” As Tim Bohen, lead trainer with StocksToTrade says, “Time and experience have taught me that missed opportunities are part of the game. There’s always another setup around the corner.” Alpha Modus Holdings Inc. is the kind of stock where that rule is not optional; it’s survival.
This is stock news, not investment advice. StocksToTrade News delivers real-time stock market updates tailored to highlight the key catalysts driving short-term price movements. Our coverage is designed for active traders and investors who thrive in fast-moving markets, with a focus on volatile sectors like penny stocks, AI stocks, Robinhood stocks and other momentum plays. From earnings reports and FDA approvals to mergers, new contracts, and unusual trading volume, we break down the events that can spark significant price action.
Looking to level up your trading game? Explore StocksToTrade, the ultimate platform for traders. With powerful tools designed for swing and day trading, integrated news scanning, and even social media monitoring, StocksToTrade keeps you one step ahead.
Check out our quick startup guide for new traders!
- How to Read Stock Charts: A Guide for Beginners
- Trading Plan: 6 Steps to Create One
- How To Create a Stock Watchlist
Ready to build your watchlists? Check out these curated lists:
Once your watchlist is set, take the next step and trade with confidence using StocksToTrade’s robust platform. Don’t miss out — grab your 14-day trial for just $7 and experience the edge you need to thrive in today’s fast-paced markets.