
Almonty Industries Inc. stocks have been trading down by -9.31 percent after negative sentiment over tungsten project financing uncertainties.
Click Here for a Millionaire's POV on Trading ALM.TO
SUBSCRIBE FOR ALERTSJOIN 50,000+ ACTIVE TRADERS
Key Takeaways
- ALM has slid from the $13s to the high-$8s in recent sessions, putting a sharp pullback on traders’ screens.
- Intraday trading in Almonty Industries Inc. shows a tight range around $9, signaling short-term consolidation after heavy selling.
- The latest report shows strong cash of roughly $1.2B against total debt near $813M, giving ALM notable funding flexibility.
- Revenue remains relatively small versus market value, with ALM trading at a steep price-to-sales multiple and rich valuation.
- Momentum traders are focusing on whether ALM can hold support near recent lows and base for the next trend move.
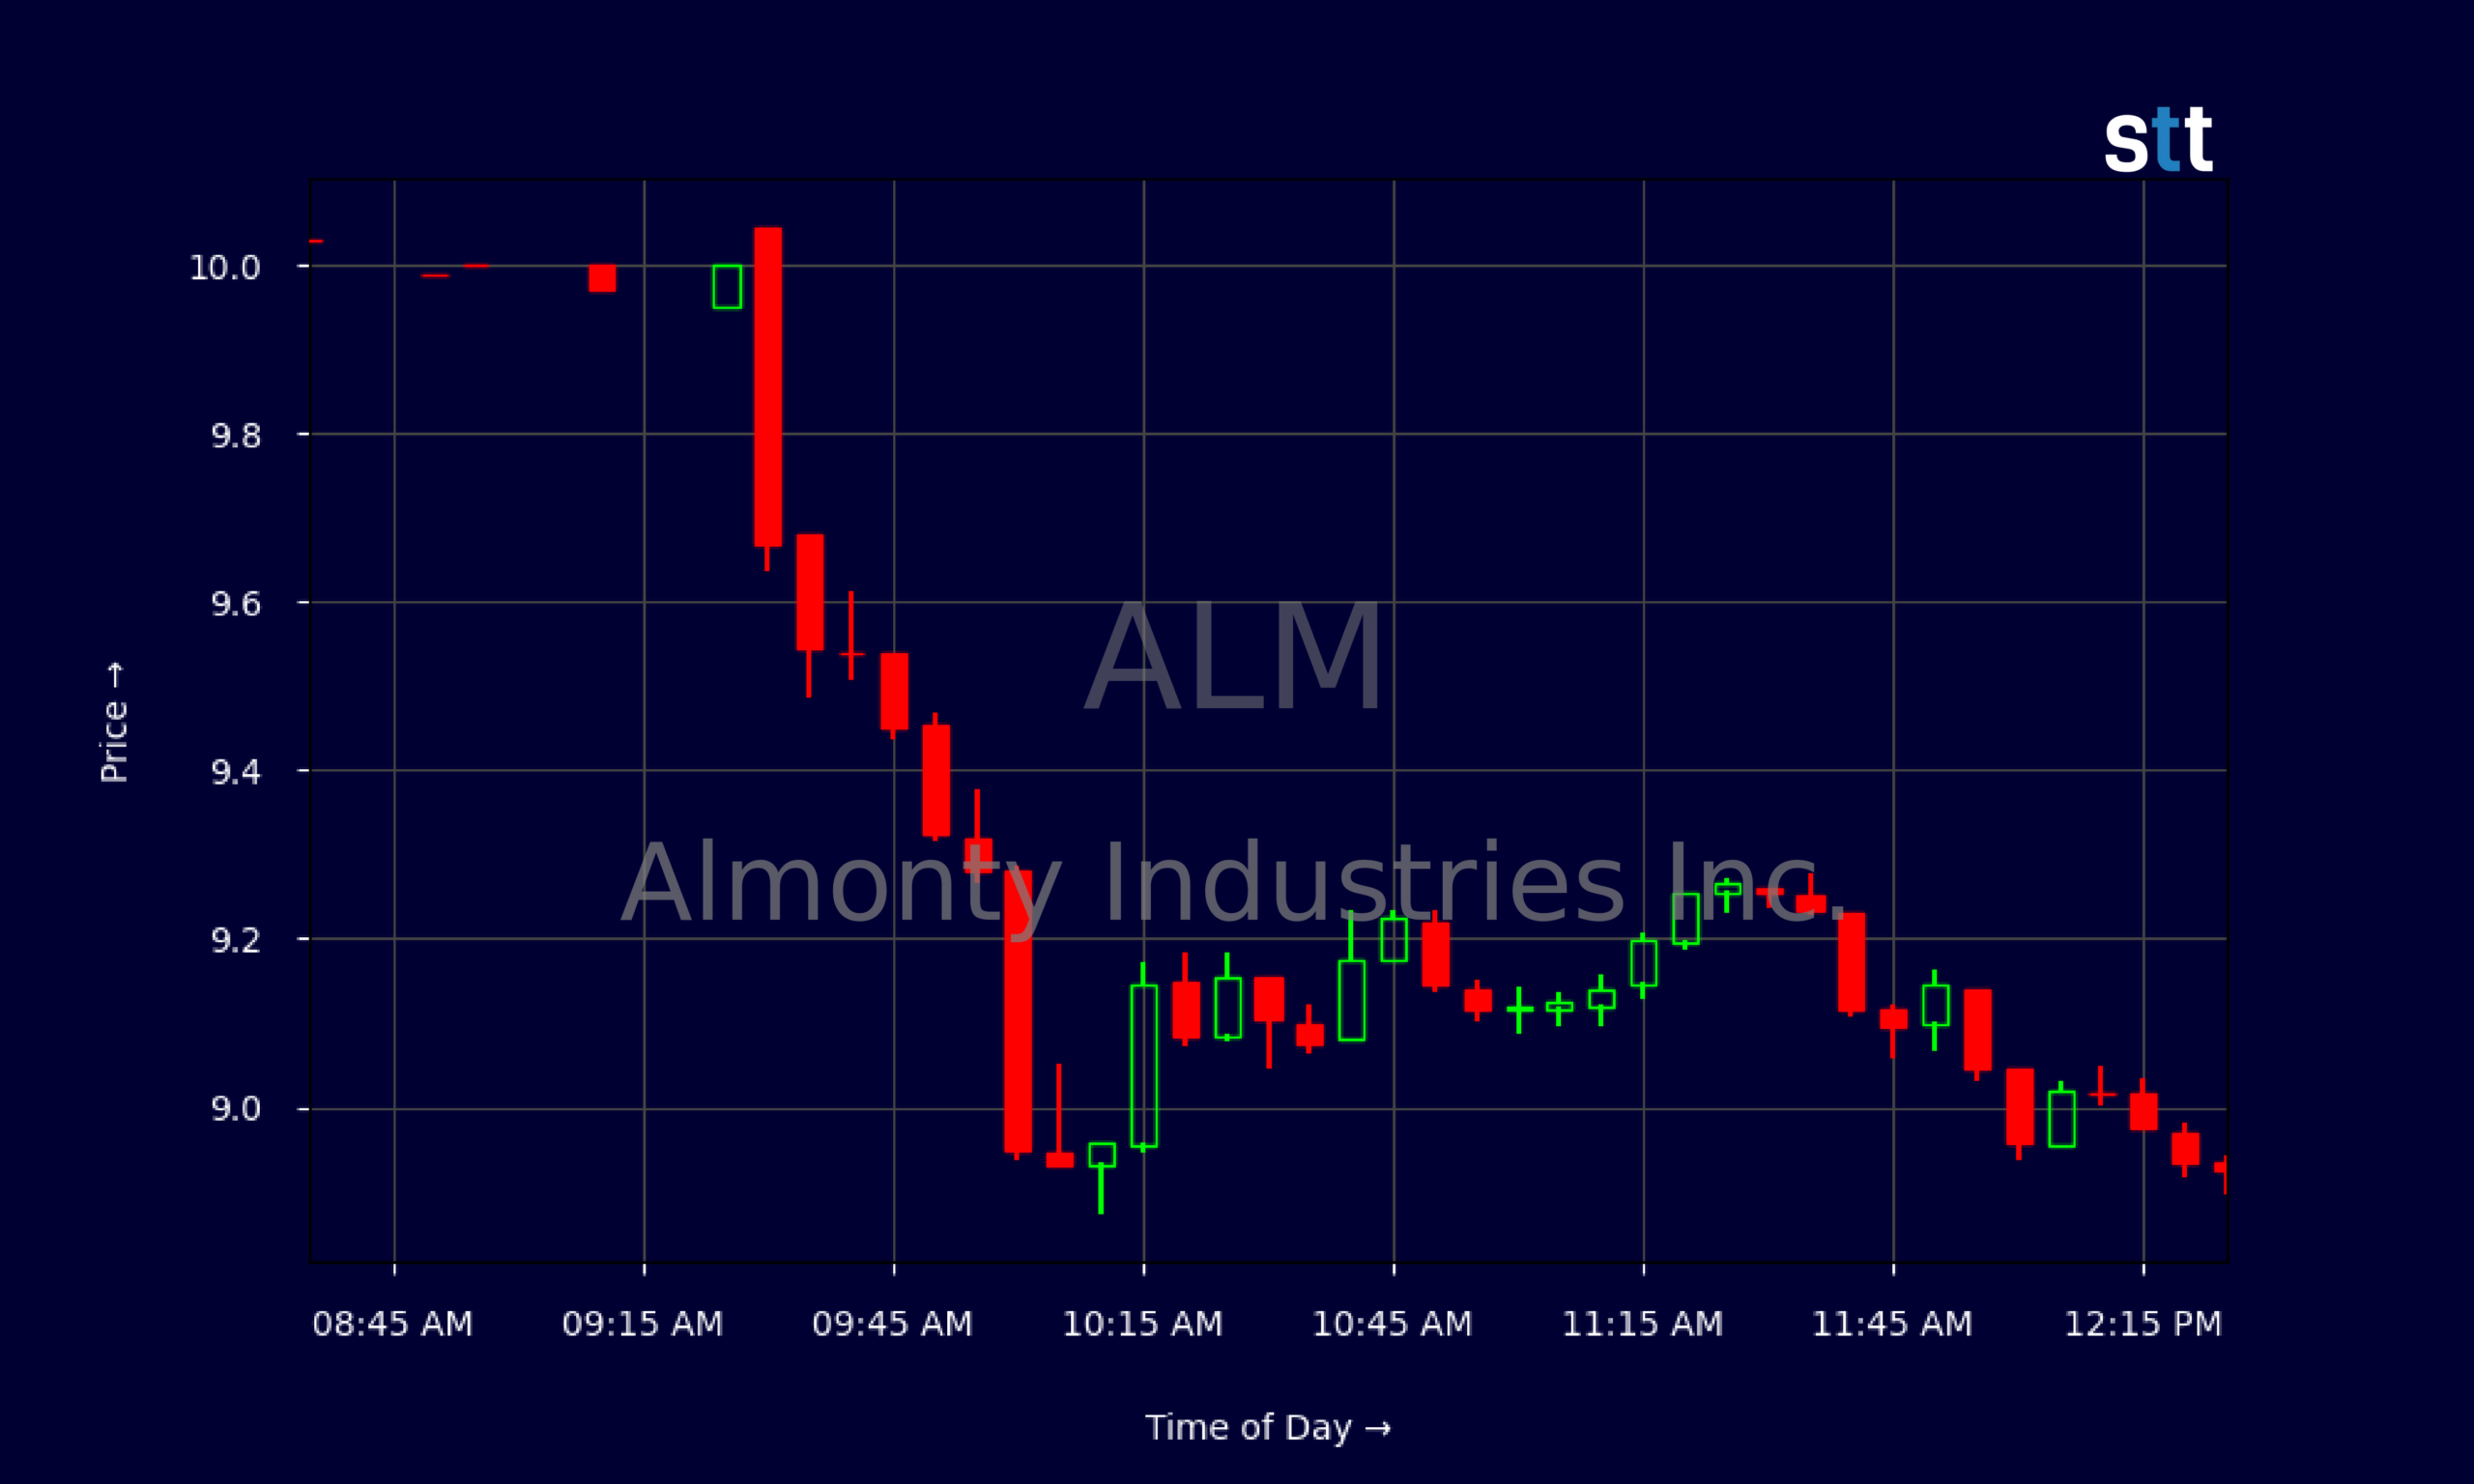
Live Update At 12:31:48 EDT: On Monday, October 19, 2026 Almonty Industries Inc. stock [NASDAQ: ALM] is trending down by -9.31%! Discover the key drivers behind this movement as well as our expert analysis in the detailed breakdown below.
Quick Financial Overview
Almonty Industries Inc. gives traders an unusual mix right now: hot valuation, big cash pile, and a stock that just got smacked lower. On the chart, ALM has fallen from closes around $13.40 on 2026/10/02 to roughly $8.91 on 2026/10/19. That is a deep correction of about one‑third in a little over two weeks, which gets the attention of any momentum trader who studies past runners.
Financially, ALM is posting annualized revenue around $32.5M, yet the market is pricing it at more than 55 times sales. That price-to-sales ratio of 55.32 is nosebleed territory for many traditional analysts, but traders know hype and future growth stories often trade rich. ALM also shows a high price-to-book ratio of 8.6, confirming the market is paying far above accounting value.
More Breaking News
- Cleveland-Cliffs Stock Draws Upgrades As Grid Steel Bet Expands
- WULF Stock Pullback Has Active Traders Watching Key Levels
- NOK Stock Slides As European ADR Weakness Deepens
- SKYD Stock Slumps As CNN Fight And Debt Overhaul Rattle Traders
At the same time, ALM’s balance sheet is loaded with cash. Cash and equivalents top $1.2B, while long-term debt runs around $756M, supported by a very strong current ratio of 9.6. That tells traders ALM is not in a cash crunch; it has room to execute. Profitability metrics are mixed, with some wildly high margins driven by non-recurring gains, which chart-focused traders should treat carefully.
Why Traders Are Watching ALM Price Action
ALM is the kind of chart that pulls in short-term traders who live for volatility. The daily candles show Almonty Industries Inc. grinding higher into the mid‑$13s through early October, then reversing hard. That move from a 2026/10/06 close near $13.04 and a 2026/10/07 push to $12.10, followed by a steady slide into the $8s, reflects a clear shift from breakout mode to profit-taking and possibly early distribution.
Zooming into intraday action, ALM opened near $10.05 and sold down toward $8.90, then spent hours chopping between $8.90 and $9.25. That pattern — fast morning fade, then a tight mid-day range — often signals a battle between late longs cutting losses and dip buyers testing the waters. For Almonty Industries Inc., that $8.85–$9.00 area becomes a key short-term level. If it holds, day traders may try to scalp bounces back toward $9.50 and above. If it cracks with volume, the next leg down can come fast.
On the fundamentals side, many traders in the Tim Sykes community will notice how ALM’s rich price-to-sales of 55.32 contrasts with modest revenue of about $32.5M. That type of disconnect often fuels sharp moves when sentiment flips. Add in strong cash, leverage under control, and high reported margins skewed by special gains, and ALM becomes a pure sentiment and momentum play in the near term.
Ultimately, chart readers will anchor on the prior high zone around $13 as overhead resistance and the current pullback zone around $9 as potential support. Whichever side breaks first is likely to define the next big swing.
Conclusion
For active traders, ALM sits at an interesting crossroads. Almonty Industries Inc. carries heavyweight liquidity on its balance sheet, solid working capital, and reported profitability helped by non-core gains. At the same time, the market is valuing ALM at rich multiples relative to its current revenue base, leaving little room for disappointment if growth slows or hype cools off. That tension often creates opportunity for disciplined trading.
The recent slide from the $13s into the high‑$8s wipes out a big chunk of prior gains and flushes out weak hands. If ALM can stabilize around the $8.90–$9.10 zone and build higher lows, short-term momentum traders may look for a snap-back toward key resistance levels. If support fails, short-biased traders will likely press the downside, aiming for further unwinding of the premium valuation.
As Tim Sykes often says, “Patterns repeat because people repeat their mistakes.” As Tim Bohen, lead trainer with StocksToTrade says, “If you’re still guessing at the end of your analysis, it’s probably not a trade worth taking.” With ALM, the pattern right now is classic — big run, crowded trade, sharp pullback, then a test of who learned from the last cycle. For traders using Almonty Industries Inc. as a study case, the playbook is clear: focus on key price levels, respect the volatility, and remember this is educational and research material, not a signal to buy or sell.
This is stock news, not investment advice. StocksToTrade News delivers real-time stock market updates tailored to highlight the key catalysts driving short-term price movements. Our coverage is designed for active traders and investors who thrive in fast-moving markets, with a focus on volatile sectors like penny stocks, AI stocks, Robinhood stocks and other momentum plays. From earnings reports and FDA approvals to mergers, new contracts, and unusual trading volume, we break down the events that can spark significant price action.
Looking to level up your trading game? Explore StocksToTrade, the ultimate platform for traders. With powerful tools designed for swing and day trading, integrated news scanning, and even social media monitoring, StocksToTrade keeps you one step ahead.
Check out our quick startup guide for new traders!
- How to Read Stock Charts: A Guide for Beginners
- Trading Plan: 6 Steps to Create One
- How To Create a Stock Watchlist
Ready to build your watchlists? Check out these curated lists:
Once your watchlist is set, take the next step and trade with confidence using StocksToTrade’s robust platform. Don’t miss out — grab your 14-day trial for just $7 and experience the edge you need to thrive in today’s fast-paced markets.