

20/20 Biolabs Inc. faces intensified pressure as critical trial setbacks dominate sentiment, and stocks have been trading down by -15.35 percent
Market Insights For Active AIDX Traders
- Price has dropped from the $1.30–$1.41 area to near $1.02 on the weekly chart, showing clear near-term selling pressure.
- Intraday action shows a hard fade from $1.36 down to $0.98, signaling aggressive supply after a brief push higher.
- Financials for AIDX and 20/20 Biolabs Inc. show heavy losses and negative margins, keeping sentiment cautious.
- Cash on the balance sheet provides some runway, but negative free cash flow highlights ongoing burn.
- Traders are watching whether $1.00 can hold as a key short-term reference level for AIDX.
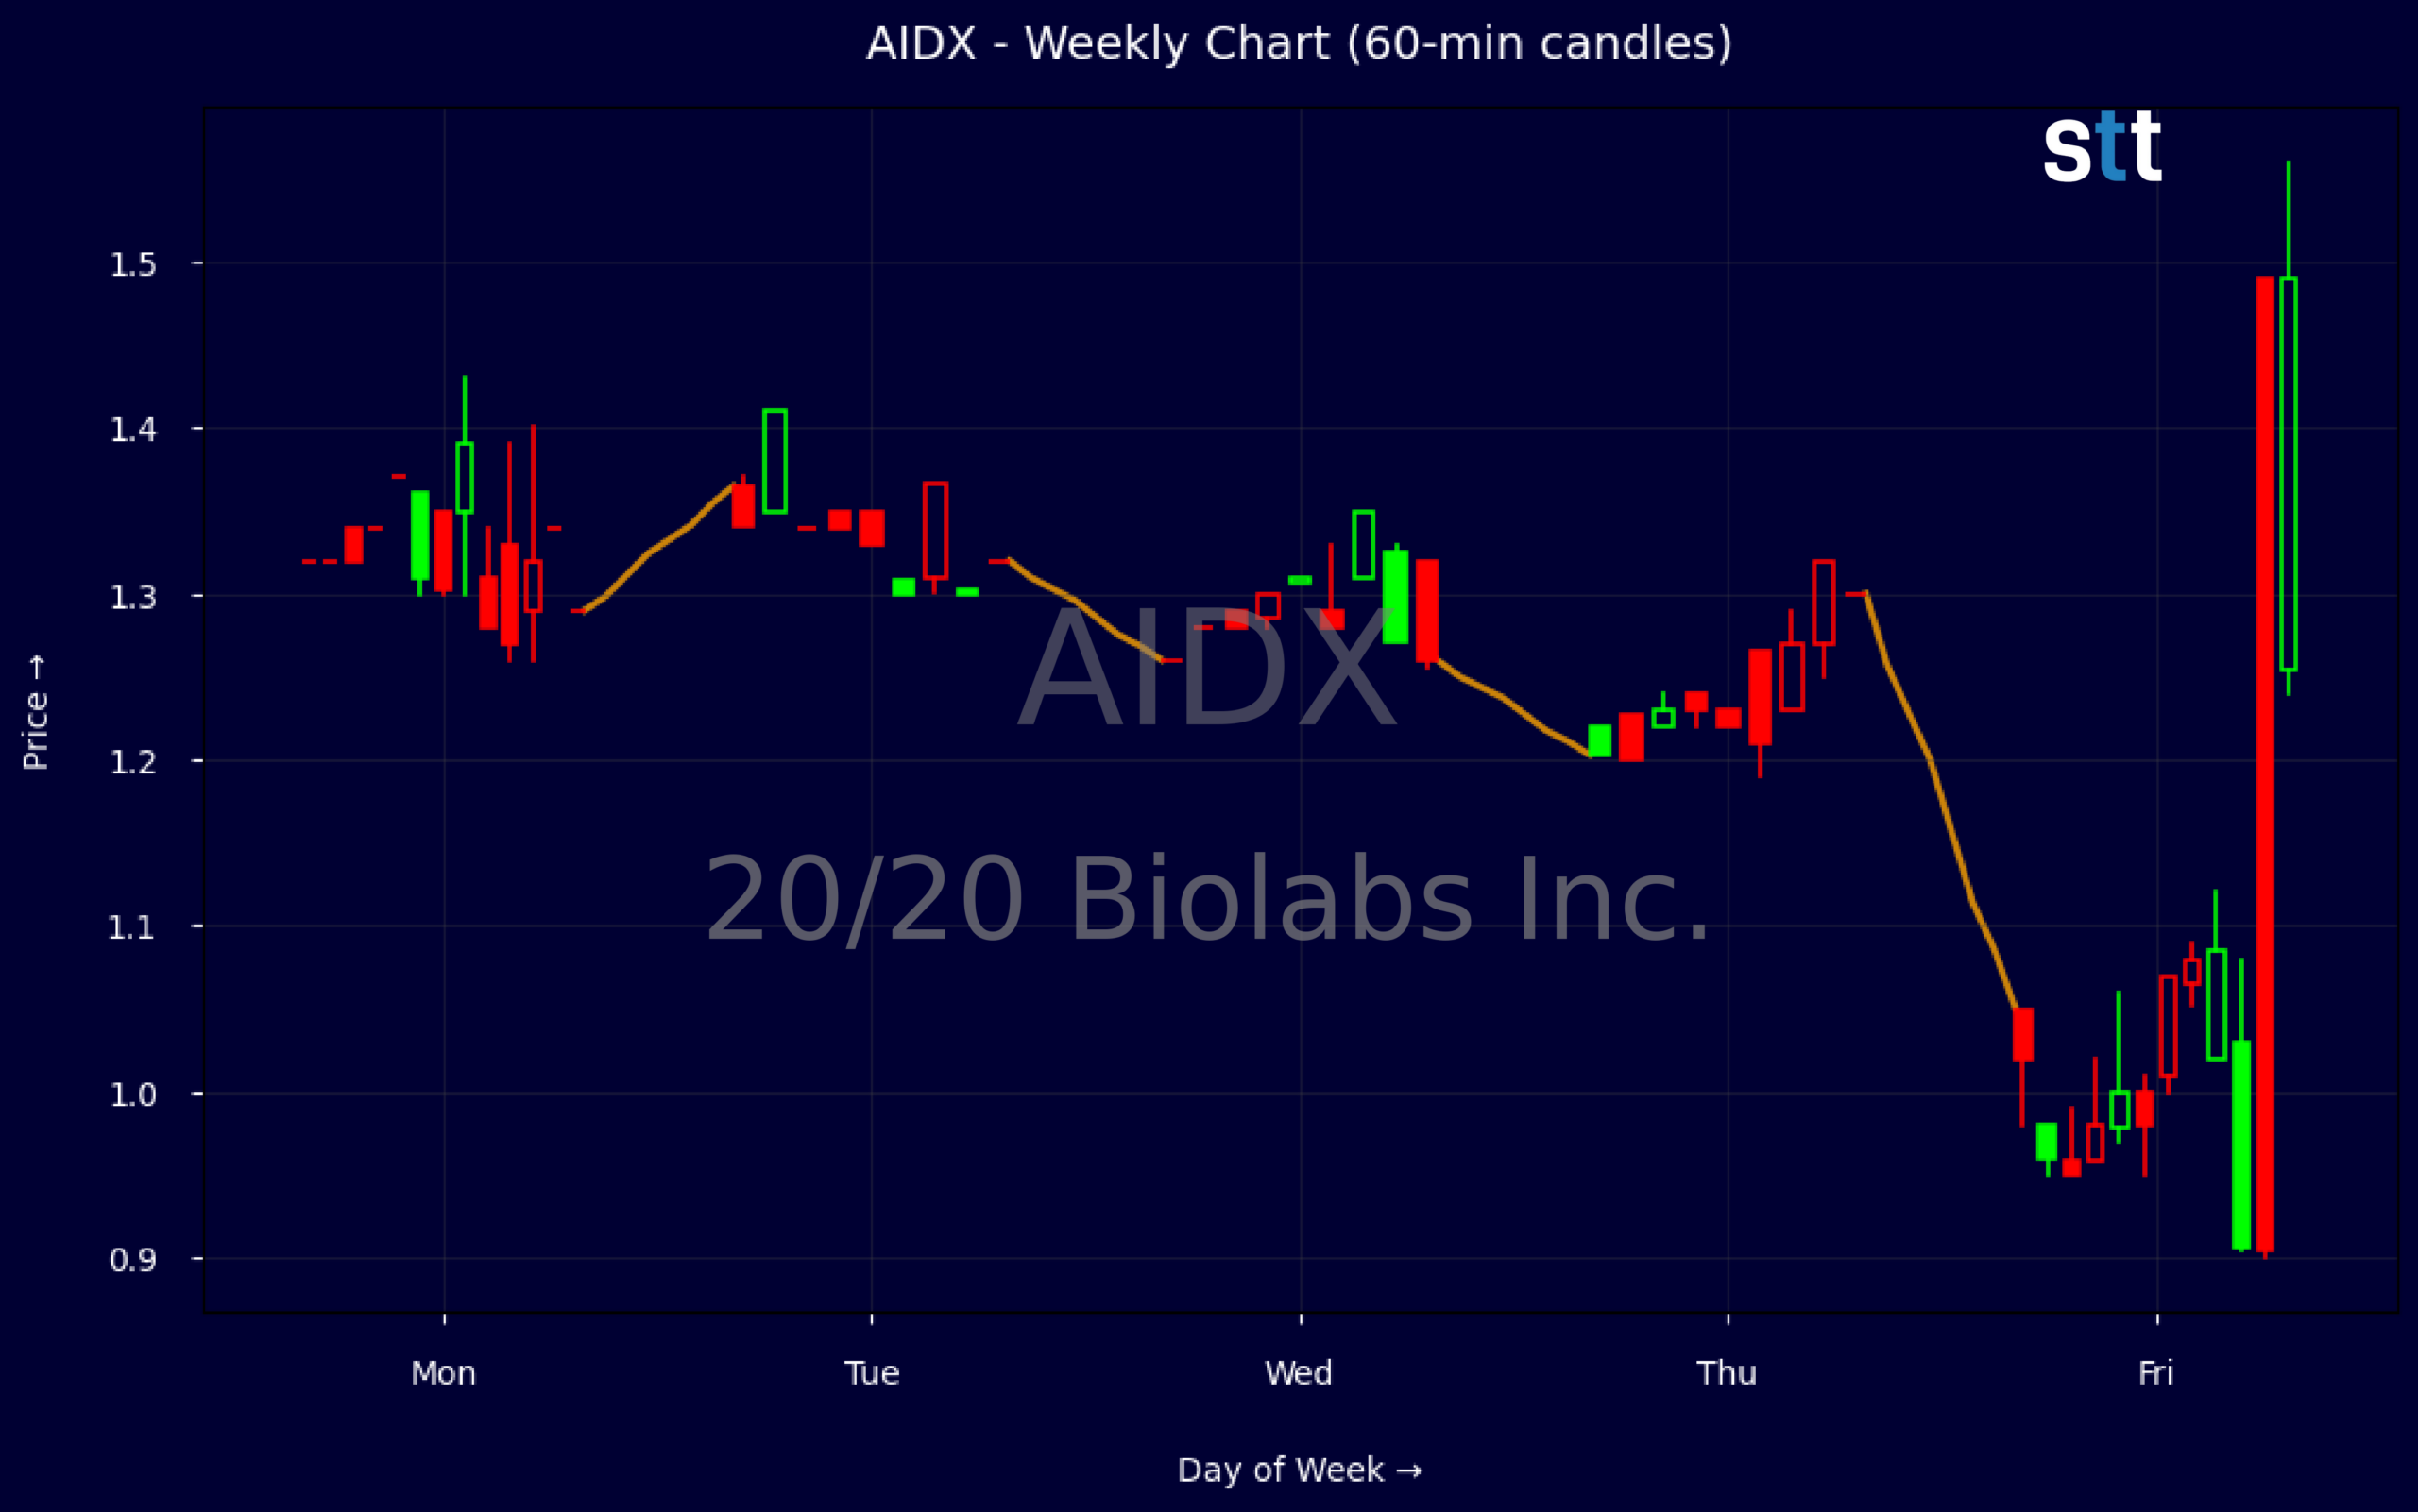
Weekly Update May 18 – May 22, 2026: On Saturday, May 23, 2026 20/20 Biolabs Inc. stock [NASDAQ: AIDX] is trending down by -15.35%! Discover the key drivers behind this movement as well as our expert analysis in the detailed breakdown below.
Healthcare industry expert:
Analyst sentiment – negative
AIDX occupies a niche in AI-enabled diagnostics but remains fundamentally a high-risk micro-cap with enterprise value near $7.1M and extreme negative profitability (pretax margin about -223%). Q1 2026 revenue was only ~$0.35M, with gross profit of ~$0.06M overwhelmed by $1.5M in operating expenses, driving a net loss of ~$2.2M and FCF of -$1.3M. Balance sheet is mixed: ~$4.2M cash supports near-term runway, but retained deficit and negative implied book metrics signal substantial value erosion.
Technically, AIDX has broken down sharply, from $1.34–1.41 early in the week to a $0.95 low and $1.02 close, confirming a clear short-term bearish trend with rising intraday volatility. Five-minute candles show persistent selling pressure on upticks and failure to hold bounces above $1.20. The key actionable trading level is $1.00: below this, downside acceleration toward the mid-$0.80s is likely; sustained reclaim above $1.20 would be the first sign of a tradable reversal.
More Breaking News
- CMCSA Stock Grinds Higher As Earnings Beat Meets Big Restructure
- No Analysis Provided
- SNAP Stock Slides As Ads, Regulation And Insider Sale Weigh
- WFF Stock Plunges Then Bases As Volatility Grips Chart
With no fresh news to re-rate the story, AIDX materially underperforms broader Healthcare and Medical Diagnostics & Screening peers on scale, margins, and capital efficiency (ROA about -15%). Sector leaders have positive EBITDA and lower leverage, while AIDX depends on external financing and stock-based compensation. Near-term, I see resistance at $1.20–1.30, support at $0.90, and bias toward a sub-$1.00 trading range. Verdict: structurally challenged, suitable only for speculative trading, not core healthcare exposure.
Quick Financial Overview
20/20 Biolabs Inc., trading under ticker AIDX, is showing a weak technical tape backed by fragile fundamentals. On the weekly chart, AIDX slipped from the $1.30–$1.41 range to a close near $1.02, with a sharp drop from above $1.20 into sub-$1.10 territory. That kind of step-down structure usually reflects steady selling rather than one-off panic. For short-term traders, it tells you momentum has turned lower and bounces will be suspect until proved otherwise.
The intraday 5-minute candle confirms that tone. Price pushed from $1.31 to $1.36, then was slammed down to $0.90 before stabilizing at $0.98. That wide range in a single bar suggests trapped longs above $1.30 and active selling into strength. For AIDX traders, any future test of the $1.30–$1.36 zone now looks like a potential supply pocket rather than clean breakout fuel.
On the fundamentals, AIDX and 20/20 Biolabs Inc. are clearly early-stage and loss-making. Quarterly revenue is about $0.35M against a net loss of roughly $2.17M, producing a pretax margin around -223%. EBITDA is negative, free cash flow is about -$1.29M, and return on assets sits near -15%. The balance sheet, however, shows total assets around $5.80M, cash of about $4.22M, and equity near $2.55M, with long-term debt a fraction of total capitalization. That means cash runway exists, but the current burn rate keeps dilution and financing risk on the table.
Conclusion
The current setup in AIDX is a textbook example of weak momentum meeting heavy fundamental drag. Price action for 20/20 Biolabs Inc. has broken down from the mid-$1.30s and is now battling around the $1.00 area, which becomes a psychological and technical pivot. Weekly lower highs and that sharp intraday fade both lean toward a bearish short-term structure until AIDX can reclaim and hold prior resistance zones.
From a financial angle, the story is straightforward. Revenue is small, losses are large, and free cash flow is sharply negative. While AIDX and 20/20 Biolabs Inc. hold a solid cash pile relative to debt, the combination of negative return on assets and deep operating losses means the business still needs to prove it can scale without constant capital raises. For traders, that mix translates to headline-sensitive price moves and a higher-risk tape.
The risk/reward picture is simple: AIDX can offer sharp bounces if liquidity rotates in, but the prevailing edge favors disciplined, short-term trading over passive holding. Key levels to watch are support near $1.00 and overhead supply between $1.30 and $1.36. As I tell my students, “Your edge in names like AIDX comes from respecting the trend, defining your levels, and treating every trade as a tactical move, not a hope-based bet.” In volatile names like this, trade review and journaling become critical. As Tim Bohen, lead trainer with StocksToTrade says, “The best way to learn is by tracking trades, wins, losses, and lessons learned. Every trade has something to teach.”
This is stock news, not investment advice. StocksToTrade News delivers real-time stock market updates tailored to highlight the key catalysts driving short-term price movements. Our coverage is designed for active traders and investors who thrive in fast-moving markets, with a focus on volatile sectors like penny stocks, AI stocks, Robinhood stocks and other momentum plays. From earnings reports and FDA approvals to mergers, new contracts, and unusual trading volume, we break down the events that can spark significant price action.
Looking to level up your trading game? Explore StocksToTrade, the ultimate platform for traders. With powerful tools designed for swing and day trading, integrated news scanning, and even social media monitoring, StocksToTrade keeps you one step ahead.
Check out our quick startup guide for new traders!
- How to Read Stock Charts: A Guide for Beginners
- Trading Plan: 6 Steps to Create One
- How To Create a Stock Watchlist
Ready to build your watchlists? Check out these curated lists:
Once your watchlist is set, take the next step and trade with confidence using StocksToTrade’s robust platform. Don’t miss out — grab your 14-day trial for just $7 and experience the edge you need to thrive in today’s fast-paced markets.