
A lot of traders want to let their winners run…
But how long can a stock go higher?
Eventually, you need to lock in profits when you have them before the stock inevitably reverses…
So today I’m sharing my theory that can help you spot when it’s a good time to exit a trade…
Because letting a winner turn into a loser is one of the worst feelings a trader can experience…
But it’s easy to do when these stocks move so fast and can reverse on a dime.
So learn this theory now…
How to Use The Five-Minute Candle Theory
I like to use five-minute candles on my intraday charts when I’m trading.
And when I make my trading plans, I like to look for three-to-one risk to reward.
But we all know trading isn’t an exact science … And a stock isn’t always going to hit your goal exactly…
So what can you do to help you lock in profits and avoid getting caught in a big death candle at a potential resistance point?
Let’s say you bought a dip and rip in a big morning runner…
You’re riding it higher — it puts in green candle after green candle and you’re excited.
You’ve gotta lock in profits before the stock reverses … But you also don’t want to exit the trade too early.
The way I spot a potential momentum shift on the chart is with my five-minute candle theory…
It’s the first red candle on the five-minute chart after multiple green candles.
If you bought the dip and rip in Smart for Life, Inc. (NASDAQ: SMFL) yesterday morning you could’ve taken profits on the first red five-minute candle.
And if you re-entered at the high of day break at $4.50, the first red candle after that spike was the beginning of the end for SMFL…
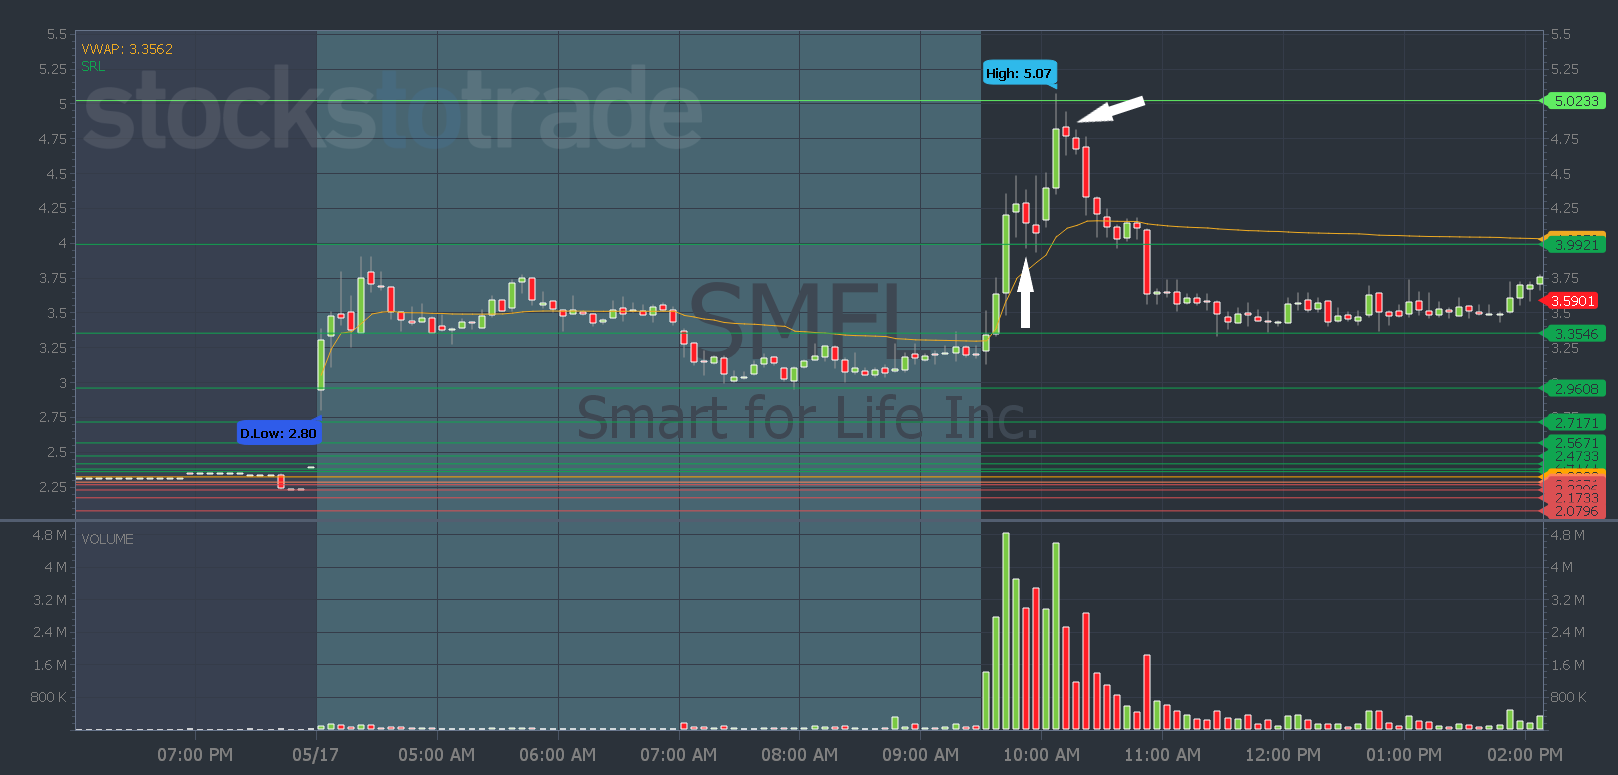
SMFL chart: 1-day, 5-minute candle — courtesy of StocksToTrade.com
I’m a big preacher about sticking to your trading plan. But sometimes using this theory will mean you sell before your goal.
It’s just another tool for your toolbox to try to help you lock in profits when you have them and avoid getting caught in big reversals.
Learn more about candlestick charts here so you understand their importance.
And watch my full video on my five-minute candle theory here.
Join me for more lessons like this on my Market Update videos three times per week.
Hope to see you there.
Have a great day everyone. See you back here tomorrow.
Tim Bohen
Lead Trainer, StocksToTrade