
Recently, a student asked, “How do you choose when there are two stocks setting up in a similar way?”
Let’s do a thought experiment because the answer is simple but important. For new traders, this could make the difference between dissecting a loss or journaling a win.
2PM ET Today: $25M Trader Jack Kellogg Reveals 4 New “Freedom Cycle” Stocks

Table of Contents
The Big Picture
For the sake of this thought experiment, let’s say you’re tracking two stocks going into the open.
Both stocks showed up on the Oracle algo, both look tradeable, and you’re just waiting for the signal at the open.
Now, let’s say the market opens and Oracle gives the signal. So, you wait for one of them to hit it.
Then, in a twist of fate, both stocks hit the buy signal at exactly the same time.
Which stock would you choose to trade?
How To Choose Which Setup Is Best
Based on the information you have right now, it’s a hard choice to make, okay?
That being said, in reality you’d already know which one takes priority. It all comes down to a core technical indicator and a market-structure metric.
Let’s use two stocks that had big moves on Monday (Oct. 12) as an example.
Disregard which 3-month chart looks better to you. Instead, focus on the fact that both stocks gapped up with volume, spiked, and then pulled back.
Mobile-health Network Solutions (NASDAQ: MNDR) gapped up on Monday and put in a solid first green day with volume:
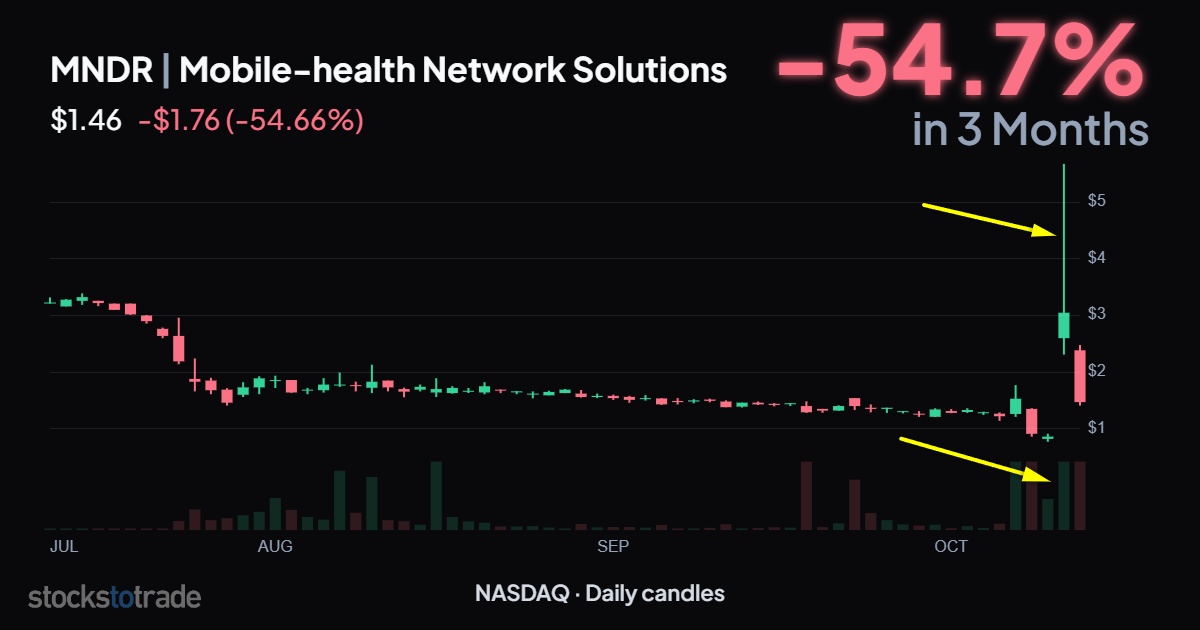
MNDR 3-month, daily candles, first green day with volume
Now check out Netcapital Inc. (NASDAQ: NCPL). Notice how the daily candle from Monday looks similar:
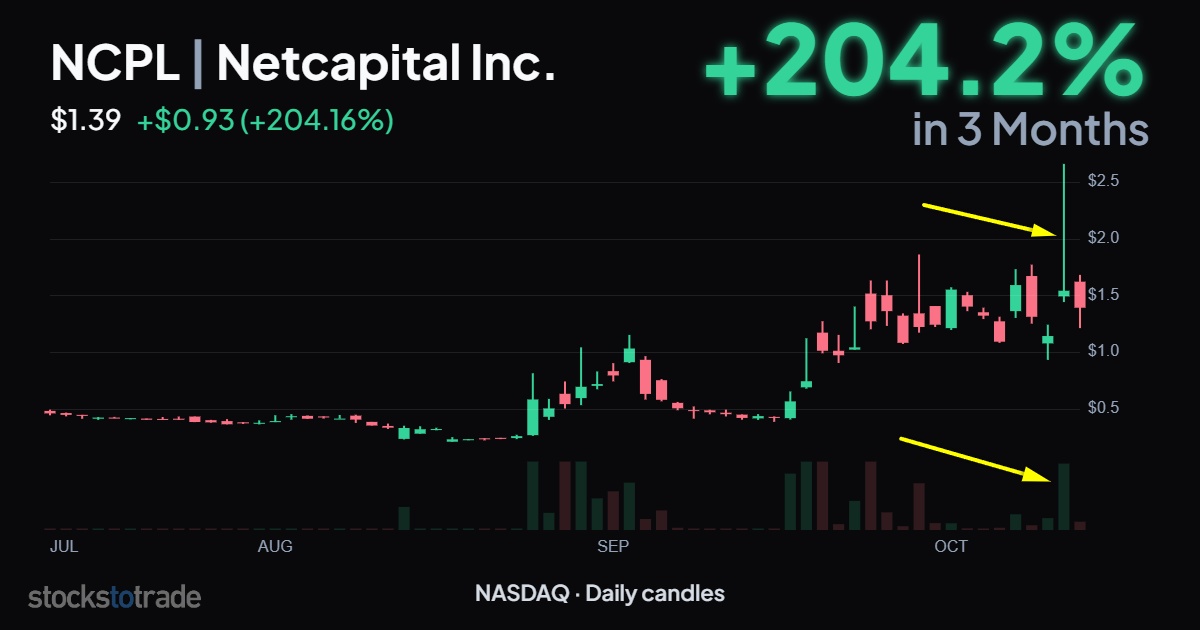
NCPL 3-month, daily candle, first green day with volume
Which stock would you choose to trade?
Now, you might say, “Tim, I need to see the intraday chart.”
Fair enough. First, MNDR:
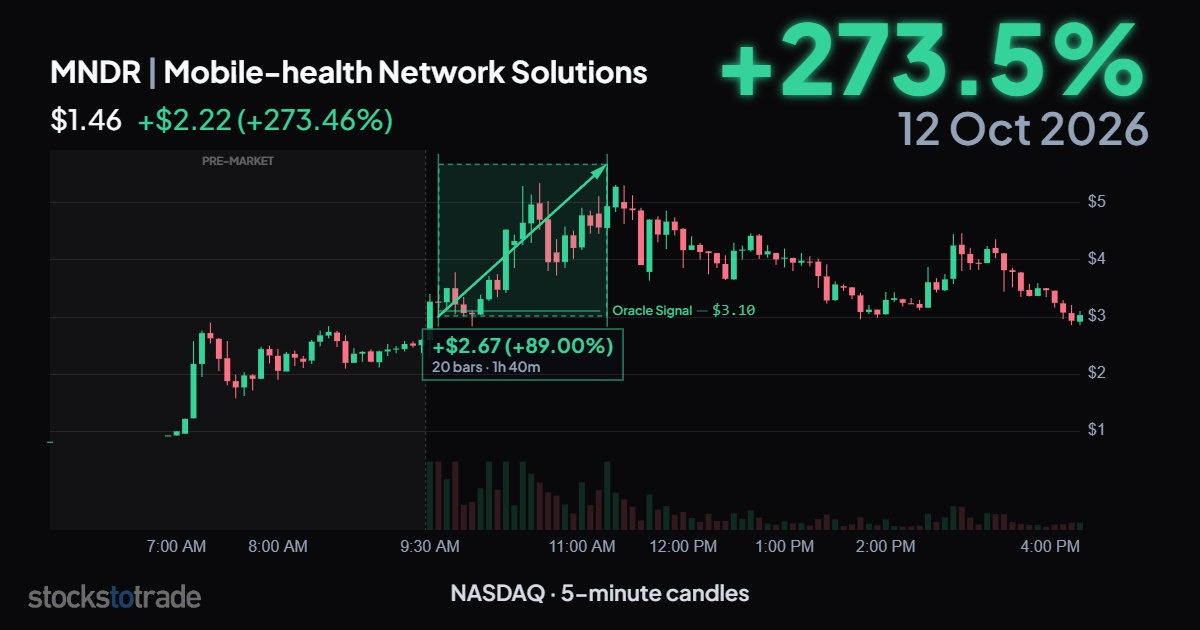
MNDR 10/12/26, 5-min candles
From the time MNDR crossed the Oracle buy signal to its intraday high, there was 89% potential upside.
Here’s the NCPL chart:
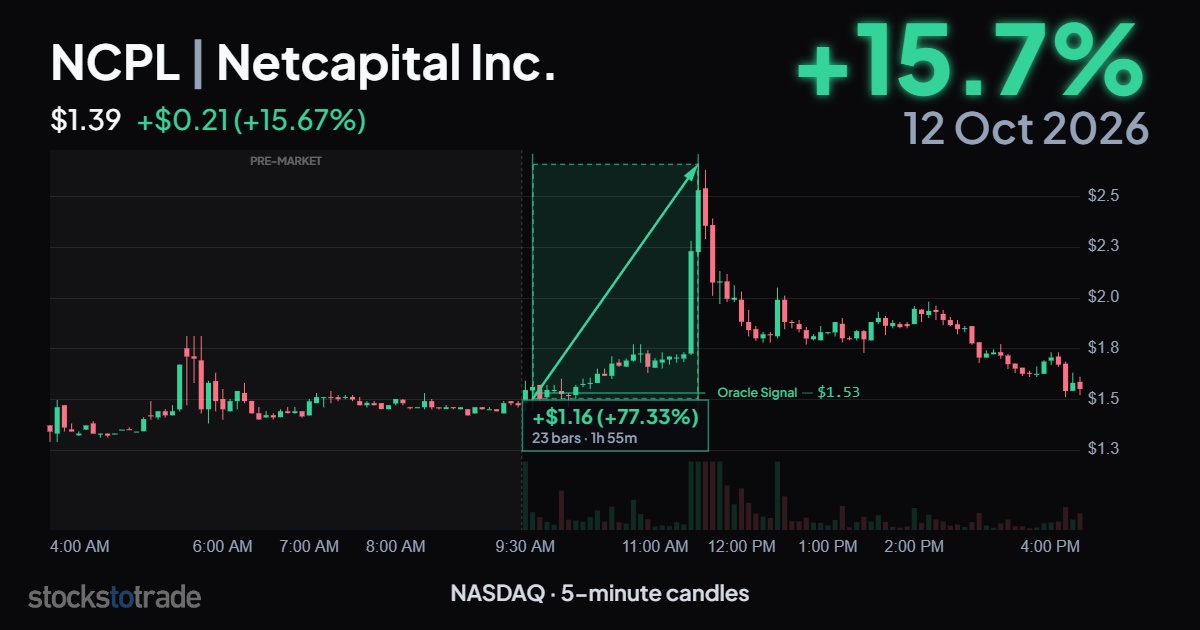
NCPL 10/12/26, 5-min candles
NCPL’s 77% potential upside from the Oracle signal is similar to MNDR.
- Both stocks set up nicely
- Both were volatile enough to show up on the Oracle algo
- And both hit the signal at 9:38 a.m. ET
So, which stock would you prioritize going into the market open?
Prioritize Volume and Float Rotation
First, we focus on volume. But volume alone isn’t enough. We also want to know the float and float rotation, because that gives you more insight into how the market is treating the stock.
So, with roughly 5 minutes to go before the open on Monday, here’s how it looked:
- MNDR had traded ~57M shares with a float of ~3.5M shares (16x float rotation)
- NCPL had traded ~9M shares with a float of ~4.3M shares (2x float rotation)
So, I’m going to choose MNDR every time because it has much higher volume and float rotation.
My Take
The reality is, I can’t trade every stock (and neither can you). So, I’ve learned to prioritize which stocks give me the best odds. In the case of MNDR and NCPL on Monday, the choice was easy.
Now, if I take the one that fails, and the other turns out to be a winner, that’s okay. Remember, we trade patterns and choose trades with the best chance for success.
Watchlist
Greenland stocks surged again yesterday after President Trump announced large-scale oil, gas, and mineral exploration plans.
Here are 3 Greenland-themed tickers to watch:
- Greenland Energy Company (NASDAQ: GLND)
- Greenland Mines Ltd (NASDAQ: GRML)
- Critical Metals Corp. (NASDAQ: CRML)
All three could be in play today, but my top choice based on volume, float rotation, and price action yesterday is GLND:
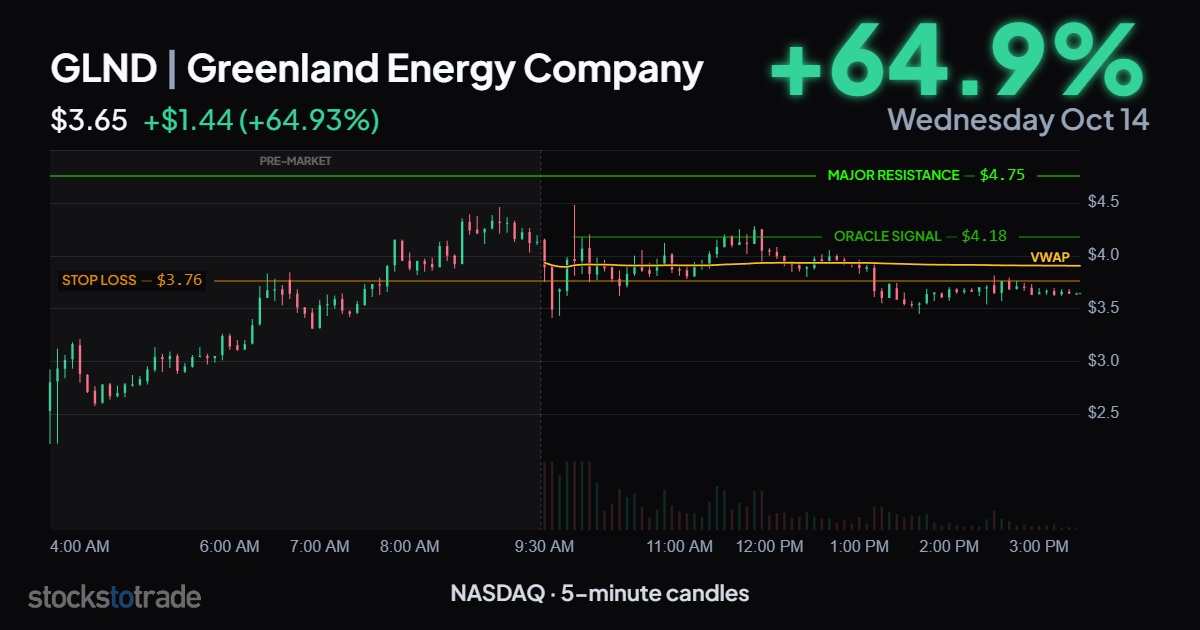
GLND 10/14/26, 5-min candles, Oracle signal, stop, major resistance
GLND is a little higher float (25.5M) so less volatile than many penny stocks. Look for breaks above yesterday’s Oracle signal ($4.18) with a target at the M/R ($4.75).
On My Radar
- Amenities galore but still no Starlink?
- SpaceX (NASDAQ: SPCX) could be worth $50T someday (trillion with a T)
- The future is now: mind reading baseball caps
- How I spot explosive $1 breakouts before they happen