
“History never repeats itself, but it does often rhyme” is a famous quote from Mark Twain.
You might hear it a lot as a trader. But do you know what it means?
Since the market is based on human emotion, similar patterns repeat…
Certain movements can strike the emotions of fear or greed and humans react in a predictable way…
But there is more to it than that.
Keeping this famous quote at the top of your mind can help you make better trading plans.
So next time you see big premarket spikers like the ones I’m about to show you…
Use it to give you insight into a potential future move. Let me show you how…
How To Use History To Make Trade Plans
If you look at big percent gainers every morning like most traders, I’m sure you came across one that we talked about in my morning SteadyTrade Team webinar yesterday…
Elys Game Technology, Corp. (NASDAQ: ELYS) was gapping up in premarket after the company dropped a press release about its gaming license in Washington D.C.
The stock was going straight up heading into the market open…
It had news, volume, and good price action.
But one look back at the stock’s history, and I could see what traders were in store for if they bought it…
The 10-day chart lays it all out…
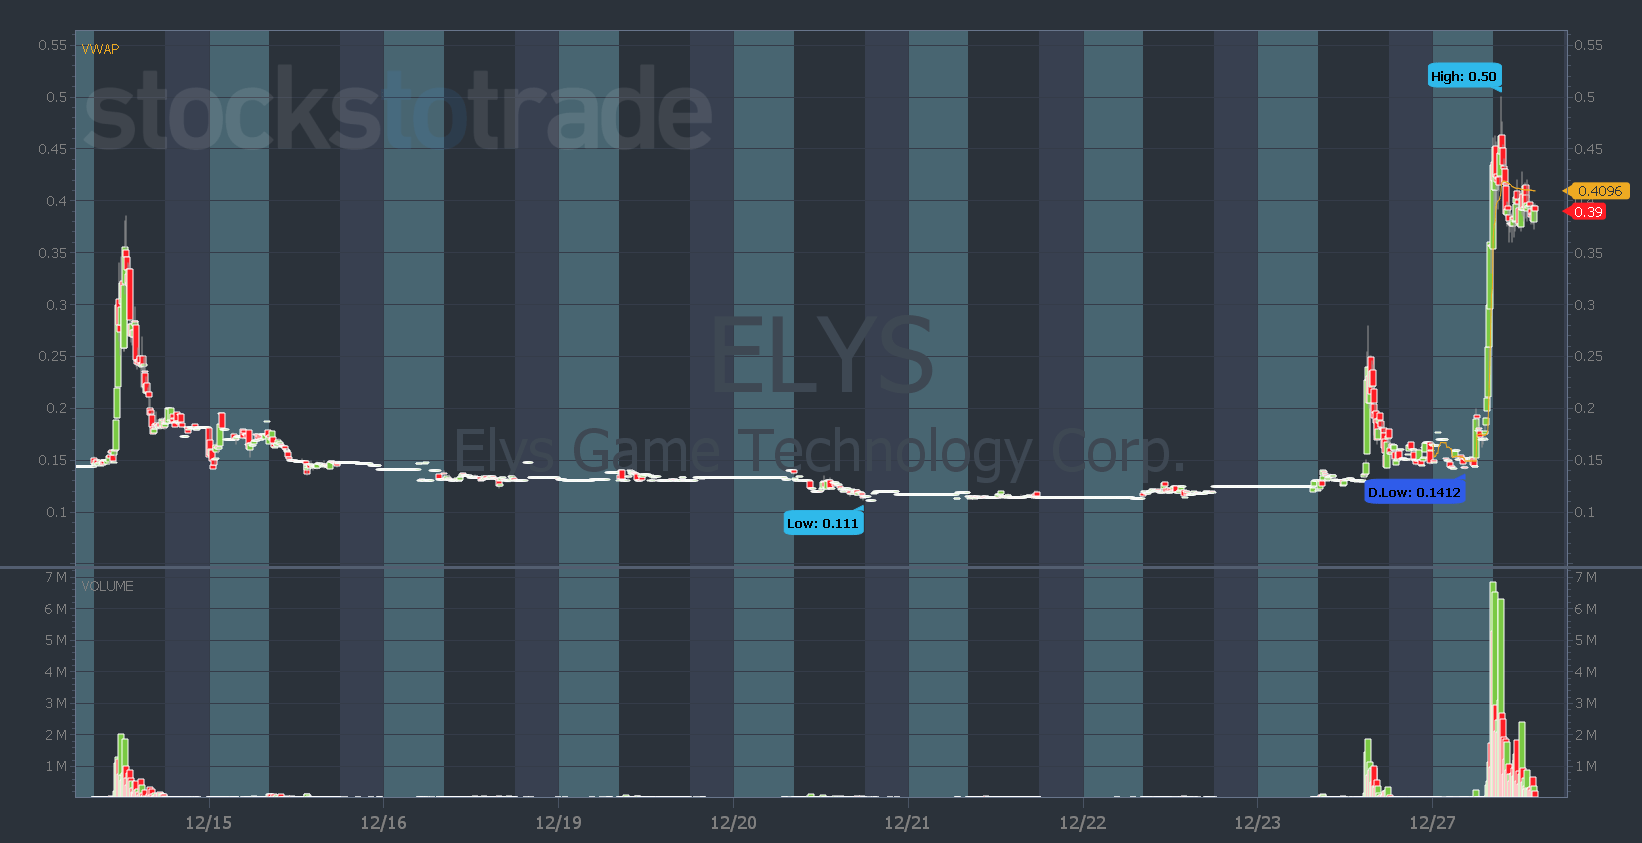
ELYS chart: 10-day, 5-minute candle — courtesy of StocksToTrade.com
What do you see about ELYS’s history?
It had two failed spikes in one week.
So what do you think the odds are on the third spike?
History will likely repeat. (Or rhyme.)
Maybe a few weeks ago in a different market, I would’ve said buy in pre, sell in pre…
But what’s the theme that’s been working in the market right now?
Mid-day and late-day moves are offering higher odd setups.
So I told SteadyTrade Team members if they want to trade ELYS — wait for the afternoon.
I didn’t say ignore it all day. Just recognize the history of the stock and what’s working in the market.
And if the stock goes in the morning and you miss it — there will always be another one.
IceCure Medical Ltd (NASDAQ: ICCM) is another recent spiker with the same chart history…
It had a massive spike and fail in after hours on December 19. Yesterday it was gapping up with no news.
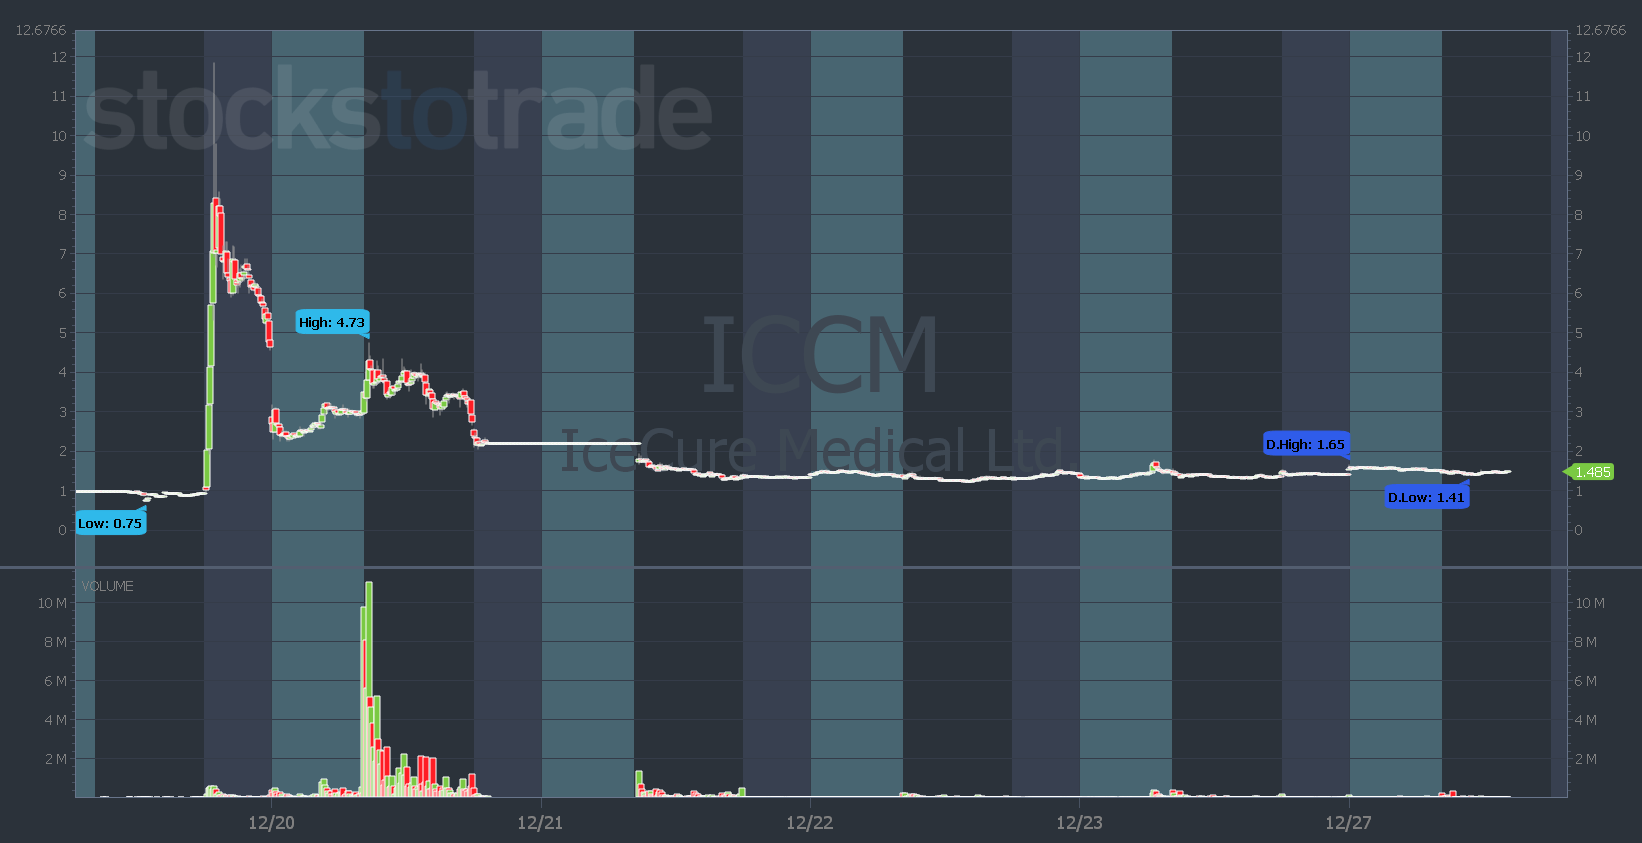
ICCM chart: 6-day, 5-minute candle — courtesy of StocksToTrade.com
So what were the odds for ICCM?
If we remember that famous quote, history is likely to repeat or rhyme and the stock will fail.
This is how using the stock’s chart history can help you make better trade plans.
Your goal as a trader isn’t to find big spikers and chase them up hoping they continue to go higher.
Your goal as a new trader is to stay in the game. To create consistent rules and build a process that you can use rinse and repeat.
That’s why I strive for consistency in my lessons. I want to give traders lessons that keep them safe and help them make the best trade plans.
Yes, it can be aggravating and frustrating if you miss a move. But in the long run, following consistent rules can help you create consistent results.
I help traders develop these rules and processes in the SteadyTrade Team. It’s an in-depth learning environment with an active chat room, twice daily live webinars, spreadsheets, resources, and more!
If you’re not ready for that level of dedication — join me every morning in Pre-Market Prep.
Starting in the New Year, Pre-Market Prep will only be available through a more exclusive and expensive education package. So join now for our lowest price before it’s gone!
Have a great day everyone! See you back here tomorrow.
Tim Bohen
Lead Trainer, StocksToTrade