
The Shooting Star candlestick pattern is a compelling tool in the toolbox of technical analysis, offering crucial insights into market trends. As an experienced trader and educator, I’ve seen many traders benefit from understanding this pattern. It often acts as an early warning signal, indicating potential market reversals.
Readers should delve into this article because it offers a comprehensive understanding of the Shooting Star Candlestick Pattern, a crucial tool for identifying potential market reversals and enhancing trading strategies.
I’ll answer the following questions:
- What is the Shooting Star Candlestick Pattern?
- How is a Shooting Star Candlestick Pattern structured?
- What does the Shooting Star tell you?
- What does a red Shooting Star Candlestick indicate?
- What does a green Shooting Star Candlestick indicate?
- What are the advantages of analyzing the Shooting Star Pattern?
- How to identify the Shooting Star Pattern?
- How to trade the Shooting Star Pattern?
Let’s get to the content!
Table of Contents
- 1 What Is the Shooting Star Candlestick Pattern?
- 2 Types of Shooting Star Candlestick Pattern
- 3 How Is a Shooting Star Candlestick Pattern Structured?
- 4 Advantages of Analyzing Shooting Star Pattern
- 5 Anatomy of a Shooting Star Candlestick
- 6 How To Identify the Shooting Star Pattern
- 7 What Does the Shooting Star Candle Pattern Reveal?
- 8 How To Interpret Shooting Star Candlestick Patterns
- 9 How To Trade the Shooting Star Pattern
- 10 Technical Analysis of the Shooting Star Candlestick Pattern
- 11 Key Takeaways
- 12 Frequently Asked Questions
What Is the Shooting Star Candlestick Pattern?
The Shooting Star candlestick pattern, a crucial tool in a trader’s arsenal, is a significant reversal indicator predominantly found at the end of an uptrend. This pattern is formed when a security’s price advances significantly during the trading session but relinquishes most of its gains to close near the open. The resultant candlestick resembles a star shooting across the sky, hence the name. This pattern is a red flag to traders, signaling that the bulls are losing control and a potential trend reversal could be imminent. Understanding and identifying this pattern is key, as it can dictate crucial buy and sell decisions in the market.
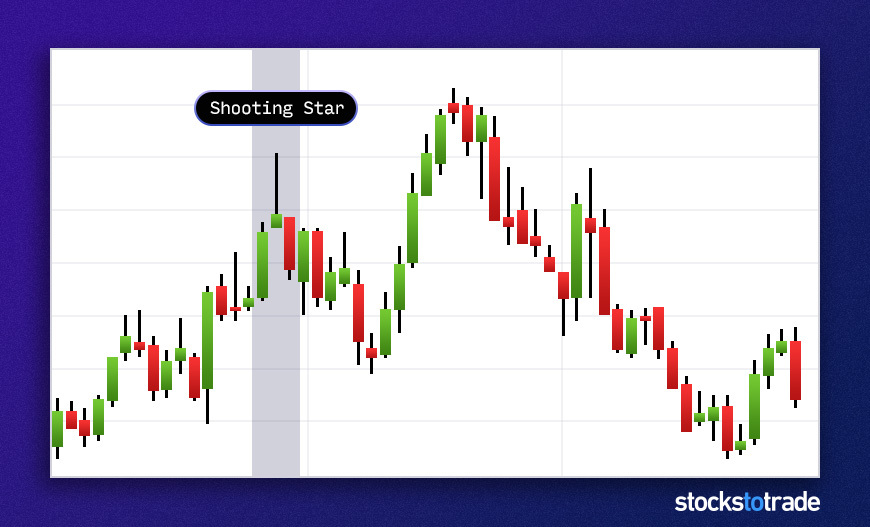
The Shooting Star Formation
A Shooting Star is characterized by a small real body, a long upper shadow, and little to no lower shadow. The small body shows little movement from open to close, while the long upper shadow indicates that buyers initially drove prices up, but couldn’t sustain those highs. This formation is a clear display of the struggle for control between the bulls and bears in the market. The pattern’s reliability increases if it forms after a significant uptrend and in a high-volume trading session, indicating stronger resistance.
What Does the Shooting Star Tell You?
The Shooting Star tells traders that the current uptrend may be weakening and a downtrend could be on the horizon. It’s a visual representation of a shift in market sentiment – from bullish to bearish. This pattern becomes more significant if it appears at a resistance level or after a prolonged price advance. However, one should not rely on this signal alone. Confirming it with other technical indicators can enhance its reliability. This pattern alerts traders to tighten stop losses or prepare for a potential change in their trading strategy.
Types of Shooting Star Candlestick Pattern
Understanding the types of Shooting Stars is crucial for traders. Typically, a classic Shooting Star has a small lower body, a long upper wick, and little or no lower wick, resembling a falling star. Variants like the Doji Shooting Star, with a smaller body, also exist and require careful analysis. The key is in the context; these patterns gain significance when they appear after a price uptrend.
From years of trading, I’ve learned that recognizing these subtle differences aids in making informed decisions. Each type offers unique insights, and combining them with other tools and indicators can strengthen your analysis.
Bearish Shooting Star
The Bearish Shooting Star is a classic top reversal signal. It appears after an uptrend and indicates that the market could be topping out. The pattern is characterized by a small body at the lower end of the trading range, with a long upper shadow. This suggests that sellers are starting to outweigh buyers, potentially leading to a downward shift in market control. The Bearish Shooting Star warns of a potential end to bullish momentum, urging traders to consider securing profits or establishing short positions.
Bullish Shooting Star
The Bullish Shooting Star, often confused with the Inverted Hammer, is less common. It occurs during a downtrend and implies a possible bullish reversal. This pattern is characterized by a small body with a long upper shadow, similar to its bearish counterpart, but it signals an unsuccessful attempt by bears to drive prices lower. The presence of a Bullish Shooting Star may indicate that sellers are losing steam and a bullish reversal could be imminent, offering a potential entry point for buyers.
How Is a Shooting Star Candlestick Pattern Structured?
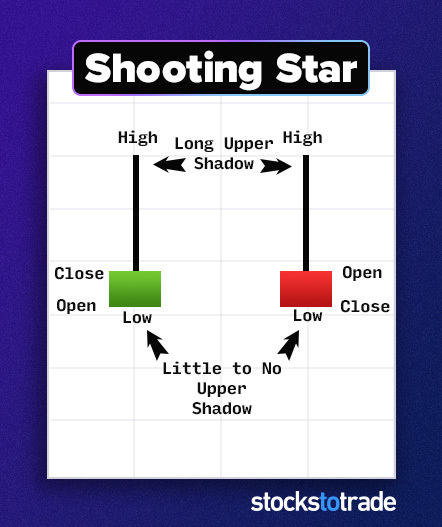
The structure of a Shooting Star candlestick is distinctive. It has a small lower body, indicating that the opening and closing prices are close together, and a long upper wick, which shows that the price was driven up but faced resistance and fell back near the opening price. The absence of a significant lower wick is also a key characteristic. This pattern typically occurs after an uptrend, suggesting a potential reversal. As traders, understanding the structure is pivotal for interpreting market sentiment. It’s not just about recognizing the shape but also about understanding the underlying market dynamics it represents.
What Does Red Shooting Star Candlestick Indicate?
A red Shooting Star Candlestick, appearing after an uptrend, is a harbinger of potential bearish reversal. The red color, indicating a close lower than the open, signifies that sellers gained the upper hand during the session. This color change is crucial as it reinforces the pattern’s bearish nature. A red Shooting Star suggests that buyers could not maintain control, and traders should be vigilant for a potential downtrend or prepare for short selling opportunities.
What Does Green Shooting Star Candlestick Indicate?
A green Shooting Star Candlestick, while less common, still carries significance. Occurring in an uptrend, it indicates that despite the closing price being higher than the opening, sellers were able to push the price down from its highs significantly. This pattern implies that bullish momentum is waning and bears are starting to exert pressure. While not as strong a reversal signal as the red variant, a green Shooting Star should still prompt traders to reassess their positions and strategy.
Advantages of Analyzing Shooting Star Pattern
Analyzing the Shooting Star candlestick pattern offers several advantages for traders, especially in terms of timing and market sentiment analysis. One of the primary benefits is its ability to signal a potential bearish reversal. This can be particularly useful in avoiding the continuation of buying into an uptrend that is likely to reverse. Additionally, this pattern can aid in setting strategic stop-loss orders, helping traders manage risk more effectively.
In my trading experience, the Shooting Star has been instrumental in providing early warnings of market shifts, allowing for timely adjustments in trading strategies. It’s also a great educational tool for beginners, teaching them to read and interpret market signals. The key to maximizing the benefits of this pattern lies in its combination with other technical analysis tools and indicators. This holistic approach enhances decision-making, leading to more informed and potentially profitable trades.
Trend Reversal Indication
The Shooting Star Pattern is a powerful indicator of potential trend reversals. When spotted at the end of an uptrend, it suggests that the bullish momentum is losing steam, providing a cue to traders to brace for a possible shift in market direction. This pattern helps in anticipating market turns, allowing for timely adjustments in trading strategies.
Easy Identification
One of the advantages of the Shooting Star pattern is its ease of identification. Its distinct structure — a small real body with a long upper shadow — makes it stand out on a candlestick chart. This clarity is beneficial for traders, especially beginners, as it provides a straightforward signal without needing complex analysis.
Timely Entry and Exit Points
The Shooting Star pattern can offer traders clear entry and exit points. Its appearance often signals the end of an uptrend, suggesting an opportune moment to exit long positions or enter short ones. Acting on this pattern can lead to timely decisions, potentially maximizing gains or minimizing losses.
Enhanced Risk Management
Analyzing the Shooting Star pattern aids in risk management. Its appearance can prompt traders to adjust stop-loss orders to protect profits or limit potential losses. This proactive approach to risk management is crucial in the unpredictable world of trading.
Confirmation With Other Technical Indicators
For a comprehensive analysis, the Shooting Star pattern should be confirmed with other technical indicators like moving averages, RSI, or volume analysis. This multi-faceted approach enhances the pattern’s reliability and informs more secure trading decisions.
Flexibility Across Timeframes
The Shooting Star pattern is versatile, applicable across various timeframes – from short-term day trading to long-term investment analysis. This flexibility allows traders of all styles to utilize this pattern in their market analysis.
Anatomy of a Shooting Star Candlestick
Analyzing the anatomy of a Shooting Star candlestick is about delving deeper into market psychology. The small lower body of the candlestick indicates a market opening and closing at similar levels, a sign of indecision. The long upper wick, however, tells a story of bulls initially taking control but eventually being overwhelmed by bears, pushing the price back down. This anatomy suggests a shift in momentum and can serve as a warning signal to traders. In my trading career, respecting these subtle market signals has often been the difference between a successful and a failed trade.
Upper Shadow
The upper shadow of a Shooting Star, typically at least twice the length of the real body, is its defining feature. It represents a significant price advance within the session, followed by a pullback. The length of the upper shadow is a key factor in determining the strength of the bearish signal.
Real Body
The real body of a Shooting Star, small and situated at the lower end of the trading range, indicates a close near the open. Its color (red or green) further adds context to the market’s sentiment. A red body strengthens the bearish outlook, while a green one slightly weakens it.
Lower Shadow
The lower shadow of a Shooting Star is usually small or non-existent. Its lack emphasizes the pattern’s characteristic of buyers losing control during the session, as there’s minimal movement below the opening price.
How To Identify the Shooting Star Pattern
Identifying the Shooting Star pattern requires a keen eye for detail. It forms after an uptrend and is characterized by its small lower body and long upper wick. The pattern indicates that the buyers initially pushed the price up, but couldn’t sustain the momentum, leading to a price close near the open.
For beginners, it’s important to use this pattern in conjunction with other technical analysis tools and not in isolation. Over the years, I’ve found that confirmation from support levels or other candlestick patterns, like the Doji, can enhance the reliability of a Shooting Star indication.
Lower Tail
The absence of a significant lower tail in a Shooting Star is a crucial element for identification. It indicates that the session’s lows were near the opening price, reinforcing the pattern’s bearish implications.
Candlestick Body
The candlestick body of a Shooting Star is small, symbolizing a negligible difference between the opening and closing prices. This feature is essential for distinguishing the Shooting Star from other patterns and confirms the indecision or struggle for control between buyers and sellers.
How To Use the Shooting Star
Utilizing the Shooting Star pattern effectively in trading requires understanding its implications and acting accordingly. When this pattern appears after an uptrend, it’s a signal to consider selling or shorting the security. Conversely, if it occurs after a downtrend, it can be an indication to exit short positions. However, it’s vital to confirm this pattern with other indicators or candlestick patterns to avoid false signals.
What Does the Shooting Star Candle Pattern Reveal?
The Shooting Star candle pattern reveals a potential bearish reversal in the market. This pattern, especially when occurring in an uptrend, suggests that the buyers are losing control to the sellers. It’s a sign of market exhaustion from the buyers’ side, indicating that an uptrend may be nearing its end. However, traders should seek confirmation from subsequent candles or other technical indicators before making a decision. In my experience, premature reactions to a single pattern without confirmation often lead to misjudgments.
Price Advance and Selling Pressure
The Shooting Star pattern reveals a significant price advance within a trading session, followed by selling pressure that brings the price back down near its open. This indicates a rejection of higher prices and suggests that a reversal might be forthcoming.
Heavy Volume and Price Decline
When accompanied by heavy trading volume, the Shooting Star pattern’s reliability increases. High volume signifies strong market interest and enhances the credibility of the reversal signal. A subsequent price decline following the pattern confirms the bearish reversal.
Reversing the Bullish Trend
The appearance of a Shooting Star at the peak of an uptrend is a clear warning sign of a possible trend reversal. It suggests that the bullish sentiment is weakening and a bearish phase may begin. Traders should be alert to this shift and adjust their strategies accordingly.
How To Interpret Shooting Star Candlestick Patterns
Interpreting Shooting Star candlestick patterns is a nuanced art. The key is to look for these patterns in the right context — primarily after an uptrend. The long upper wick indicates a failed attempt by buyers to continue the upward trend, suggesting bearish sentiment.
However, one must be cautious and look for confirmation in subsequent candles or overlapping technical analysis tools. In my years of trading, I’ve learned that these patterns, while indicative, are not standalone signals and require corroboration.
A Resistance and Exit Strategy Indicator
The Shooting Star serves as an indicator of resistance levels and aids in formulating exit strategies. Its appearance at resistance points signals that the upward price movement might be halted, providing traders an opportunity to exit long positions or initiate short trades.
Using the Shooting Star To Spot Sell Signals
Spotting a Shooting Star can be a cue for traders to look for sell signals. Its formation, especially in a high-volume environment, indicates that the bullish momentum is fading, and a downward price movement could be imminent.
How To Trade the Shooting Star Pattern
Trading the Shooting Star pattern involves a strategic approach. Once identified, particularly after an uptrend, it’s prudent to wait for additional confirmation, such as a bearish follow-up candlestick or a break below a support area. Setting a stop loss just above the Shooting Star’s high can be a wise move.
It’s also important to consider the overall market context and other technical indicators. Trading isn’t just about recognizing patterns; it’s about understanding the broader market dynamics and acting accordingly.
Identifying Price Reversals
Trading the Shooting Star pattern effectively involves identifying potential price reversals. Once this pattern is spotted, especially after a sustained uptrend, it signals that the trend might be reversing, guiding traders to either secure profits from long positions or prepare for short selling.
Establishing Resistance Levels
The Shooting Star helps in establishing resistance levels. Its formation suggests that the current price level is facing resistance, and it might be difficult for the price to advance further, indicating a potential selling point or short entry.
Confirmation Candles
Confirmation candles following a Shooting Star are essential for validating its signal. A subsequent bearish candle, closing below the Shooting Star’s low, confirms the bearish reversal, providing a stronger basis for making a trade decision.
Technical Analysis of the Shooting Star Candlestick Pattern
In technical analysis, the Shooting Star candlestick pattern plays a pivotal role in signaling potential bearish reversals. This pattern is a prime example of how candlestick formations can provide insightful information about market sentiment and possible price movements. Its appearance, especially at the bottom of a downtrend, should be analyzed with caution. In my years of trading and teaching, I emphasize the importance of context when interpreting candlestick patterns.
The Shooting Star, while a strong indicator on its own, gains more predictive power when combined with other technical analysis tools. It’s crucial to assess the pattern within the broader market framework, considering factors such as volume, historical price levels, and market trends. Understanding and applying these nuances can be the difference between a good and a great trading decision.
How Accurate Is the Shooting Star Candlestick Pattern in Technical Analysis?
The Shooting Star candlestick pattern is a valuable tool in technical analysis, but its accuracy isn’t absolute. It’s a signal, not a guarantee. The pattern’s reliability increases when combined with other technical indicators and analysis methods. From my experience, considering volume, trend strength, and market sentiment alongside the Shooting Star enhances its predictive accuracy.
How Reliable Is a Shooting Star in Technical Analysis?
The reliability of a Shooting Star in technical analysis is contingent on context and confirmation. It’s a potent bearish signal post an uptrend, but its effectiveness is amplified when corroborated by other technical factors. Traders should always look for additional evidence before making a decision based solely on a Shooting Star pattern.
The Difference Between the Shooting Star and the Inverted Hammer
The main difference between the Shooting Star and the Inverted Hammer lies in their market implications and position in a trend. While both have similar structures, a Shooting Star appears after an uptrend indicating a potential bearish reversal. In contrast, an Inverted Hammer occurs after a downtrend, suggesting a possible bullish reversal. Understanding these nuances is essential for accurate market analysis and decision-making.
Key Takeaways
In the intricate world of candlestick patterns, the Shooting Star stands out as a critical bearish reversal indicator, particularly effective after an uptrend. However, its true power lies in its use alongside other analytical tools and confirmation signals. It’s essential for traders, especially beginners, to understand and respect the market narratives these patterns reveal.
There are a ton of ways to build day trading careers… But all of them start with the basics.
Before you even think about becoming profitable, you’ll need to build a solid foundation. That’s what I help my students do every day — scanning the market, outlining trading plans, and answering any questions that come up.
You can check out the NO-COST webinar here for a closer look at how profitable traders go about preparing for the trading day!
What patterns do you look for? If you made it this far, write “I won’t trade without a plan” in the comments!
Frequently Asked Questions
What is a Shooting Star Candlestick in Forex?
In Forex, a Shooting Star candlestick is a bearish reversal pattern indicating a potential shift from a bullish to a bearish market. It’s characterized by a small lower body and a long upper wick, appearing after an uptrend.
What Does an Inverted Shooting Star Candlestick Show?
An Inverted Shooting Star candlestick is essentially an Inverted Hammer, typically indicating bullish reversal potential when occurring after a downtrend.
How Often Does the Shooting Star Candlestick Pattern Happen?
The frequency of the Shooting Star candlestick pattern in markets varies. It’s not an everyday occurrence but appears often enough for traders to recognize and capitalize on its implications when it does appear.
What’s the difference between the Shooting Star and Morning Star Pattern Candlesticks?
The Shooting Star and Morning Star patterns are not the same — understanding the distinction is crucial for traders. While both are significant patterns within the realm of candlesticks, they signal different market sentiments. The Shooting Star is a bearish reversal indicator appearing after an uptrend and is characterized by a short body with a long upper wick.
On the other hand, the Morning Star is a bullish reversal pattern that emerges after a downtrend, consisting of three candles with the middle one gapped away from the others. It’s essential to recognize that despite some visual similarities, these patterns convey different market information.