
Amidst significant market attention and broader sector pressures, a notable decline of -11.72% in Gold Royalty Corp.’s stock is observed Thursday, influenced primarily by sentiment reflected in news reports, including concerns over future financing and operational challenges.
Current Stock Performance
Gold Royalty Corp has been catching attention in the stock market with notable movements in its stock prices. Here’s what you need to know about the current scenario:
- The stock price of Gold Royalty Corp recently dropped from $1.56 to $1.35, showing a decrease of 13.5% over a short span. However, this decline followed a short-lived zenith where the stock briefly reached $1.6.
Live Update At 10:03:06 EST: On Thursday, March 20, 2025 Gold Royalty Corp. stock [NYSE American: GROY] is trending down by -11.72%! Discover the key drivers behind this movement as well as our expert analysis in the detailed breakdown below.
-
The company experienced a temporary surge in trading causing a notable fluctuation in its daily stock price. Highs and lows within the day spanned between $1.44 and $1.29.
-
Recent dip in the steady price movement seems to align with market perturbations, highlighting potential investor hesitancy in the current market context.
-
Stock’s trading volume indicates a pattern of high activity, often preceding investor interest peaks when market expectations oscillate strongly.
These fluctuations reflect subtle shifts in investor sentiments and the market’s pulse toward potential future profitability.
Gold Royalty Corp’s Financial Snapshot
In the world of trading, patience and observation are key to making well-informed decisions. It’s important to hold off on acting impulsively, as emotions can often lead us astray. As Tim Bohen, lead trainer with StocksToTrade says, “I focus on what a stock is doing, not what I want it to do. Let the stock prove itself before you make a move.” This mindset emphasizes paying attention to the actual behavior of a stock, rather than projecting our hopes onto it. By allowing the stock’s performance to guide our actions, traders can navigate the market with a clearer vision and a steadier hand.
Financial snapshots often offer a glimpse into the path ahead. Here are some integral elements for Gold Royalty Corp:
-
Revenue Overview: With reported revenues at $3.048M, the company’s pursue appears steadfast. While modest, it hints at underlying stability despite market slip-ups.
-
Profitability and Ratios: A pre-tax profit margin of -629.1 underscores challenges, yet suggests an untapped growth opportunity if managed adeptly. With a price-to-sales ratio at 126.39, it hints at high expectations from the market players.
-
Market Valuation Metrics: The enterprise value stands interestingly at $305.1M, offering a perspective into the market’s perception of the company’s overall worth. Price-to-book ratio at 0.46 suggests Gold Royalty’s market price is favorable relative to its asset value.
-
Strength Puzzles: Financial strength is led by a leverage ratio of 1.3, reflecting a reasonable debt harmony. With long-term debt highlighted at $48.9M, proper debt management can fuel gentry growth paths.
More Breaking News
- Big Moves for Bit Digital: What’s Next?
- Strategy Adjustments Lead to Invesco’s Positive Market Sentiment
- Is Rivian’s Stock Set For A Comeback?
The story gleaned from these numbers conveys the spirited capacity of Gold Royalty Corp as an investment pathway. Amidst potential challenges, optimistic undertones offer fertile ground for further examinations.
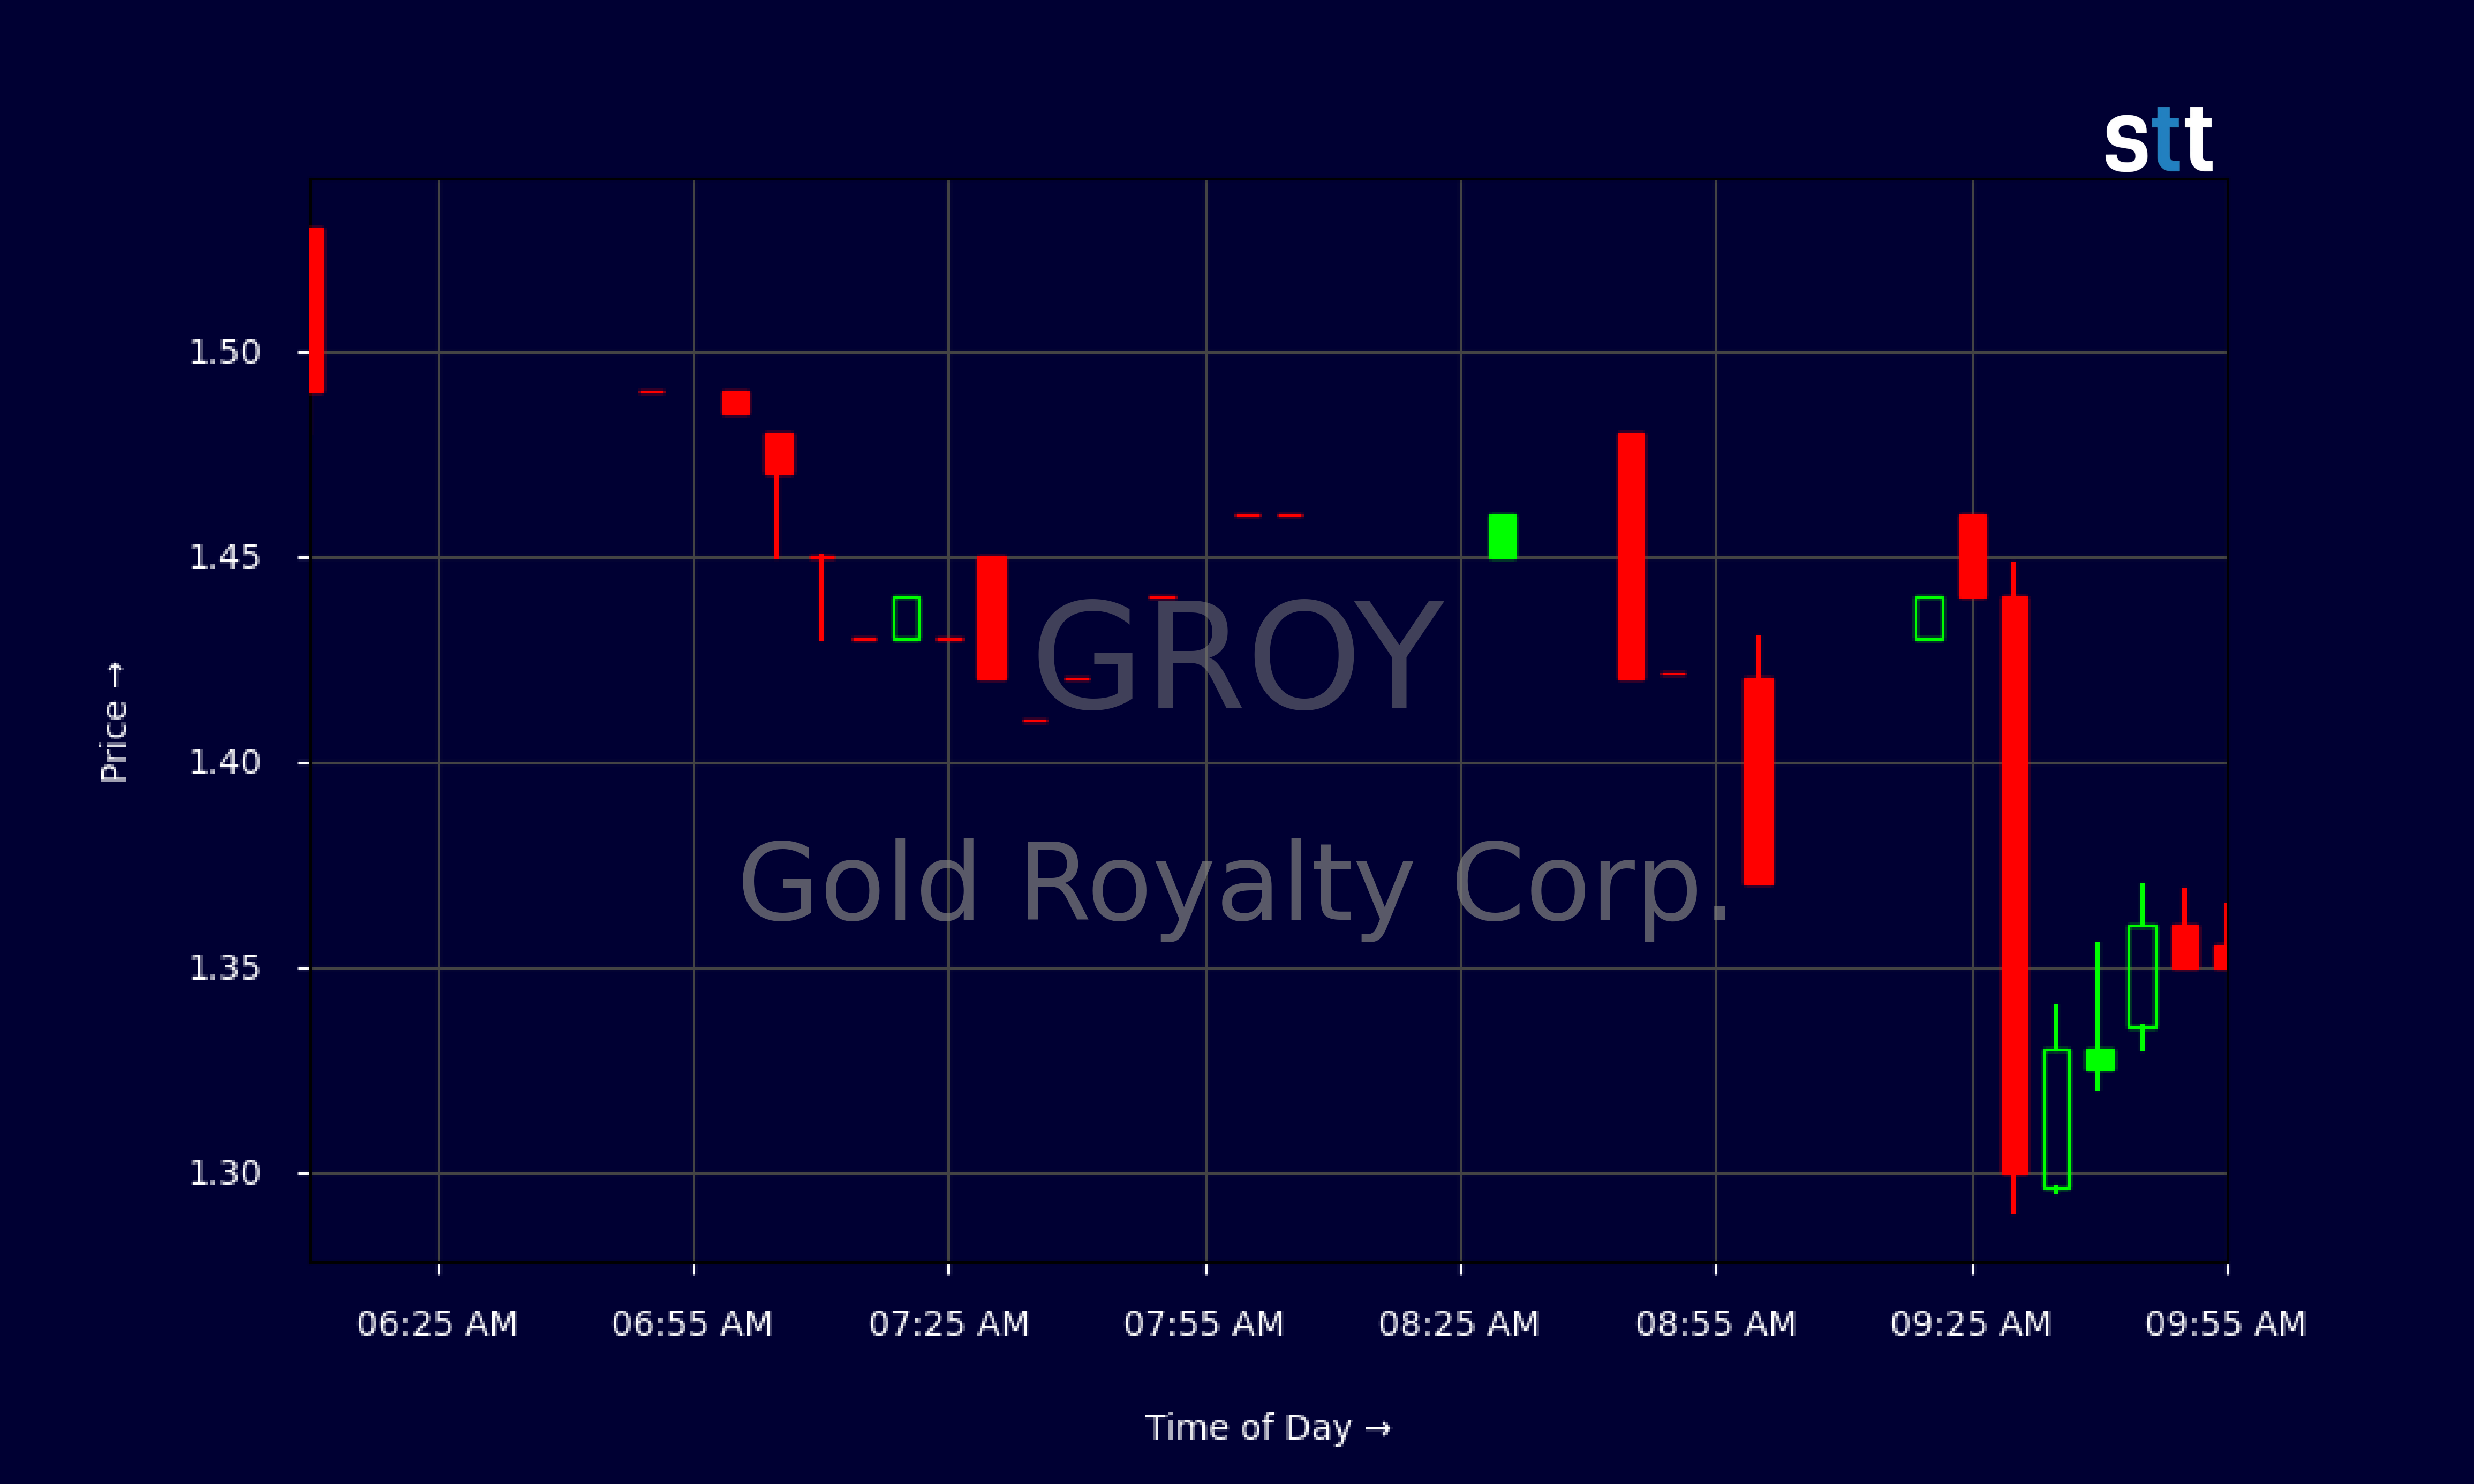
Analyzing GROY’s Stock Chart Dynamics
Looking into GROY’s historic and intraday trading data, the numbers unveil intuitive patterns:
-
The volatility noted in the 5-minute intraday chart conveys active market play, with significant price swings marking potential entry and exit points for traders.
-
The stock, opening at $1.44, saw a dramatic sweep down to $1.29 and managed to inch back to a closing value of $1.3507, a clear outlook of seller-dominant sessions.
-
On a multi-day chart, visual shifts from peaks of $1.6 to lows of $1.35 suggest short-lived momentum, conveying to investors that while times of rise are promising, foresight in exit strategies are vital.
These fluctuations are less like calm waters and more like rolling seas, with waves commanding strategic foresight and well-planned navigations.
Impact of Financial Reports
Quick glance at the recent Gold Royalty Corp’s financial report:
-
Net Income Outcomes: Directly recording a net income from continuous operations at $3.423M. Surprising? Yes. It emerges as a beacon amidst the brackish ebb.
-
Operating Expense Levels: Substantial expenses, equating to $2.428M, may seem daunting, yet highlight areas of focus for strategic cuts and efficiency implementation measures.
-
Strategic Gains/Losses: A noteworthy deferred tax of $5.891M embarks on the winds of accounting strategies, while cash flow adjustments extend potential elasticity in liquidity management.
These metrics stand as cornerstone queries for investors, investing jig-saw pieces into predictable outcome forecasts.
Navigating Gold Royalty Corp’s Trajectory
What does the forward trajectory look like?
-
With fluctuating prices on a roller-coaster, Gold Royalty Corp poses as an intriguing prospect for those well-versed to endure short-term volatility, keeping a patient eye on long-haul rewards.
-
The current market indices reflect an unstable patch—not uncommon for growing enterprises.
-
Its stock price history and financial surveys align with a landscape abundant with potential a la carte picks.
Gold Royalty’s path mirrors a winding road where strategic foresight and patient trading mark the journey to potential golden opportunities. As Tim Bohen, lead trainer with StocksToTrade says, “There’s a pattern in everything; you just have to stick around long enough to see it.” Still, it demands adeptness in grappling transient market flux for those ready to bear the gilt-edged challenges ahead.
This is stock news, not investment advice. StocksToTrade News delivers real-time stock market updates tailored to highlight the key catalysts driving short-term price movements. Our coverage is designed for active traders and investors who thrive in fast-moving markets, with a focus on volatile sectors like penny stocks, AI stocks, Robinhood stocks and other momentum plays. From earnings reports and FDA approvals to mergers, new contracts, and unusual trading volume, we break down the events that can spark significant price action.
Looking to level up your trading game? Explore StocksToTrade, the ultimate platform for traders. With powerful tools designed for swing and day trading, integrated news scanning, and even social media monitoring, StocksToTrade keeps you one step ahead.
Check out our quick startup guide for new traders!
- How to Read Stock Charts: A Guide for Beginners
- Trading Plan: 6 Steps to Create One
- How To Create a Stock Watchlist
Ready to build your watchlists? Check out these curated lists:
Once your watchlist is set, take the next step and trade with confidence using StocksToTrade’s robust platform. Don’t miss out — grab your 14-day trial for just $7 and experience the edge you need to thrive in today’s fast-paced markets.