
The Moving Average Convergence Divergence (MACD) is a powerful trading indicator used by traders to identify changes in the strength, direction, momentum, and duration of a trend in a stock’s price. Its importance in trading cannot be overstated as it combines elements from different trading indicators to provide a comprehensive view of price movements. Understanding MACD is crucial for both new and experienced traders aiming to enhance their trading strategy.
Whether you are new to trading or looking to refine your strategies, this guide will provide you with detailed insights into how MACD works, how to interpret its signals, and how to integrate it into your trading activities to improve decision-making and maximize profits.
I’ll answer the following questions:
- What is the MACD Indicator and how does it work?
- How can traders use the MACD Indicator to determine market position?
- What are the components of the MACD Indicator?
- How do you calculate the MACD Indicator?
- What are some effective strategies for trading with the MACD Indicator?
- How can the MACD Indicator signal the best times to enter and exit trades?
- Can the MACD Indicator be used for stop loss placement?
- How can the MACD Indicator be adjusted for different market conditions?
Let’s get to the content!
Table of Contents
- 1 What Does MACD (Moving Average Convergence Divergence) Mean?
- 2 Components of the MACD Indicator
- 3 How to Calculate MACD
- 4 How to Trade Using MACD
- 5 Tips for Refining MACD Trading Skills
- 6 How to Adapt MACD in Different Market Conditions
- 7 Integrating MACD with Other Technical Analysis Tools
- 8 Key Takeaways
- 9 Frequently Asked Questions
- 9.1 Is MACD Suitable for Beginners?
- 9.2 Can MACD Indicate the Best Times to Enter and Exit Trades?
- 9.3 Is There a Way to Use MACD for Stop Loss Placement?
- 9.4 What Is the Big Picture Advice on Using the MACD Indicator?
- 9.5 How Can Traders Use MACD to Determine Market Position?
- 9.6 What Are Key Differences Between Types of Oscillators?
- 9.7 How Can Examples Improve Understanding of Support and Uptrend Analysis?
What Does MACD (Moving Average Convergence Divergence) Mean?
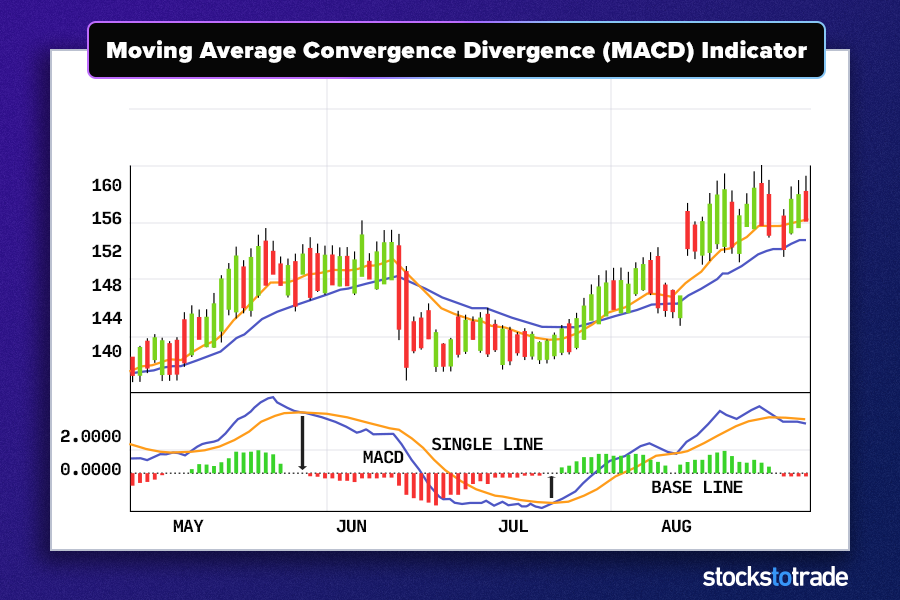
Developed by Gerald Appel in the late 1970s, MACD is a trend-following momentum indicator that shows the relationship between two moving averages of a security’s price. The MACD is calculated by subtracting the 26-period Exponential Moving Average (EMA) from the 12-period EMA. The result of this calculation is the MACD line. A nine-day EMA of the MACD called the “signal line,” is then plotted on top of the MACD line, which can function as a trigger for buy and sell signals.
MACD is a valuable tool for traders as it provides a visual summary of the changes in a stock’s momentum and can be used to forecast reversals in trends through divergence and crossover techniques. Its versatility in different markets and trading strategies makes it an indispensable tool in a trader’s toolkit.
Components of the MACD Indicator
The MACD consists of three main components that traders need to understand: the MACD line, the signal line, and the histogram, each offering different insights and signals depending on their movement.
MACD Line
The MACD line is the heart of this indicator and is used to gauge the momentum and the direction of the stock’s price. It’s calculated by subtracting the 26-period EMA from the 12-period EMA. The significance of the MACD line lies in its ability to show, at a glance, the current price trend alongside momentum, allowing traders to anticipate potential buy and sell opportunities.
A rising MACD line indicates increasing bullish momentum, suggesting it might be a good time to buy. Conversely, a falling MACD line can indicate bearish momentum, signaling a potential sell opportunity.
Signal Line
The signal line, typically a 9-period EMA of the MACD line, acts as a trigger for MACD signals. Comparing this line with the MACD line helps traders identify possible buy and sell signals based on crossovers.
When the MACD line crosses above the signal line, it is a bullish signal, which suggests that it might be a good time to buy.
Conversely, when the MACD line crosses below the signal line, it is a bearish signal, suggesting it might be time to sell.
Histogram
The MACD histogram measures the distance between the MACD line and its signal line. The histogram is positive when the MACD line is above the signal line (bullish) and negative when the MACD line is below the signal line (bearish). This component helps traders understand the strength of the momentum and anticipate potential reversals.
- Expanding positive histogram suggests increasing bullish momentum.
- Expanding negative histogram suggests increasing bearish momentum.
- A shrinking histogram may suggest a potential reversal or weakening trend.
How to Calculate MACD
To effectively use the MACD indicator, traders must first understand how it is calculated. Here’s a step-by-step guide:
- Calculate the 12-period EMA of the closing prices.
- Calculate the 26-period EMA of the closing prices.
- Subtract the 26-period EMA from the 12-period EMA to find the MACD line.
- Calculate the 9-period EMA of the MACD line to get the signal line.
- Subtract the signal line from the MACD line to create the MACD histogram.
These calculations lay the groundwork for interpreting the MACD graph and making informed trading decisions.
12-period EMA
The 12-period EMA is crucial for capturing short-term price trends and is faster to react to price changes than the 26-period EMA. It’s particularly useful for gauging recent price action and momentum, forming the faster component of the MACD line.
26-period EMA
The 26-period EMA acts as the slower component of the MACD line, providing a smoother and less sensitive line that offers a longer-term perspective on price movements. This average is essential for establishing the baseline of the MACD line.
Signal Line (9-period EMA)
The signal line is derived from the MACD values themselves, representing a 9-period EMA of the MACD line. This line acts as a smoother of the MACD line, providing key signals through its relationship with the MACD line. The crossover of the MACD line above or below this signal line is often used by traders as an indication of potential buying or selling opportunities. Understanding the dynamics between these lines is critical for executing timely trades.
How to Trade Using MACD
For day traders, the MACD indicator is not just a tool—it’s an essential part of the trading arsenal. It helps in pinpointing market momentum and identifying potential entry and exit points, which are crucial for the fast-paced nature of day trading. By understanding the nuances of the MACD, traders can leverage its signals to make quick, informed decisions. This involves not only recognizing the basic MACD line and signal line crossovers but also understanding the implications of the histogram’s changes. For a comprehensive guide on using MACD effectively in your day trading strategy, explore MACD for day trading, which provides detailed insights and practical tips to enhance your trading performance.
The MACD indicator is not only useful for gauging market momentum but also for identifying potential entry and exit points. Here are some strategies to effectively trade using the MACD:
- Look for line crossovers: The crossing of the MACD line above the signal line suggests bullish momentum and could be a buy signal, whereas a crossover below could suggest bearish momentum and a potential selling point.
- Pay attention to divergences: When the price of an asset makes a new high but the MACD fails to do so, it may indicate a possible reversal to the downside. Conversely, if the price hits a new low but the MACD does not, this could signal a reversal to the upside.
- Monitor the histogram for momentum: Increases in the histogram’s height suggest an increase in momentum, which can help confirm signals from line crossovers or divergences.
To do effective technical analysis, you’ll need a powerful trading platform.
StocksToTrade has the trading indicators, dynamic charts, and stock screening capabilities that traders like me look for in a platform. It also has a selection of add-on alerts services, so you can stay ahead of the curve.
Grab your 14-day StocksToTrade trial today — it’s only $7!
Tips for Refining MACD Trading Skills
Improving your trading with the MACD indicator involves practice and refinement. Here are some tips to enhance your proficiency:
- Backtest your strategies: Use historical data to test how your MACD-based strategies would have performed. This can help you refine them without risking real money.
- Combine MACD with other indicators: No indicator should be used in isolation. Combine MACD with other technical tools like RSI or Bollinger Bands to confirm signals and improve accuracy.
- Stay updated on market conditions: The effectiveness of MACD can vary with market conditions. Regular review and adjustment of your strategies in response to new information can lead to better outcomes.
How to Adapt MACD in Different Market Conditions
Adjusting MACD settings according to market volatility and trend characteristics can significantly enhance its effectiveness. Here are some adaptations to consider:
- Use shorter EMAs in fast-moving markets: Decreasing the length of the EMAs (e.g., using a 5-period EMA instead of 12) can make the MACD more responsive to rapid price changes.
- Increase EMA periods in slow-moving markets: To reduce false signals in less volatile markets, increase the EMA periods to smooth the data further.
- Adjust the MACD histogram thresholds: Customize the threshold levels of the MACD histogram to better suit the volatility levels and your risk tolerance.
Integrating MACD with Other Technical Analysis Tools
For a more robust analysis, MACD can be combined with other technical indicators:
- Relative Strength Index (RSI): Combining MACD with RSI can help confirm momentum and potential reversal points, as both aim to identify overbought and oversold conditions.
- Bollinger Bands: Using Bollinger Bands with MACD can help identify the strength of the trend. When the price touches the outer bands, and MACD confirms the trend’s momentum, it might signal a strong continuation or potential reversal.
Key Takeaways
- MACD is a versatile indicator that measures momentum and can signal changes in the trend.
- Effective use of MACD involves understanding its components and their calculations.
- Combining MACD with other indicators enhances trading decisions and accuracy.
There are a ton of ways to build day trading careers… But all of them start with the basics.
Before you even think about becoming profitable, you’ll need to build a solid foundation. That’s what I help my students do every day — scanning the market, outlining trading plans, and answering any questions that come up.
You can check out the NO-COST webinar here for a closer look at how profitable traders go about preparing for the trading day!
How do YOU use the MACD indicator? Let me know in the comments!
Frequently Asked Questions
Is MACD Suitable for Beginners?
Yes, MACD is one of the more straightforward technical indicators to understand and use, making it suitable for beginners. Its clear signals for entry and exit points provide a good foundation for those new to trading.
Can MACD Indicate the Best Times to Enter and Exit Trades?
Absolutely, MACD is excellent for identifying potential entry and exit points through crossovers and divergences. However, it is most effective when used in conjunction with other indicators and analysis techniques.
Is There a Way to Use MACD for Stop Loss Placement?
MACD can inform stop-loss settings by indicating when the momentum behind a trade is waning, which might suggest a good time to exit to minimize losses. For instance, a reversal in MACD’s direction shortly after a trade can be a signal to set a stop loss to protect gains or prevent further losses.
What Is the Big Picture Advice on Using the MACD Indicator?
The MACD (Moving Average Convergence Divergence) is a type of oscillator used in technical analysis to identify trends in the prices of stocks. It is shown on charts and typically includes two moving averages that help to capture momentum in the price chart. By observing the relationship between these averages—when they converge or diverge—you can gauge the strength of an uptrend or downtrend.
How Can Traders Use MACD to Determine Market Position?
Traders can use the MACD indicator to help determine their position in the market by analyzing the movement of highs and lows on a price chart. This oscillator helps identify potential entry and exit points within a range, by signaling when the asset is potentially overbought (highs) or oversold (lows). This is critical for managing risks and optimizing results.
What Are Key Differences Between Types of Oscillators?
Understanding the difference between types of oscillators such as the MACD and others like the RSI (Relative Strength Index) is crucial. While MACD focuses on trend and momentum through moving averages, other oscillators might measure different aspects like velocity or market extremes. Each type of oscillator offers unique insights and suits different trading strategies and stocks.
How Can Examples Improve Understanding of Support and Uptrend Analysis?
Examples can be instrumental in learning how to use technical analysis tools like the MACD to identify support levels and confirm uptrends. By studying example charts that illustrate these concepts, traders can see practical applications of spotting when a stock might bounce off a support or continue in an uptrend. These visual aids help solidify the basics and refine the application of theoretical knowledge in real trading scenarios.