
Spotting entries, exits, and risk levels are some of the biggest areas traders struggle with…
But they’re also some of the most crucial things to learn as a trader.
How else can you make repeatable trade plans for stocks without that knowledge?
Well, if you’re struggling to find those levels that can help you ride upside momentum while keeping risk in check — I have a theory for you…
I call it the five-minute candle theory.
It might sound a bit complicated but don’t worry, I’m here to break it down into simple steps…
I’ll show you how it showed an entry point and risk level in PaxMedica, Inc. (NASDAQ: PXMD) yesterday morning before it soared 90%!
Mastering the 5-Minute Candle Theory in Day Trading
The five-minute candle theory is like a secret code that can help you make smart decisions when trading stocks.
But before you can understand what it is, you have to understand candlesticks.
Important Candlestick Levels to Know
Each candle has two parts: the body and the wick.
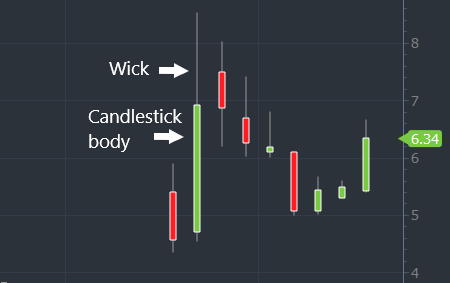
The top and bottom of the body are determined by the open and closing price of the stock within the candle time frame.
Since we’re talking about the five-minute candle theory, the candle time frame is five minutes.
Now, the body tells us whether the stock’s price went up (if it’s green) or down (if it’s red) during those five minutes.
And the wick shows us how much the price moved during those five minutes. The longer the wick, the more volatile move the stock had.
What Is The 5-Minute Candle Theory?
I actually have two ways you can use the 5-minute candle theory…
Both of my approaches use five-minute candles on the chart to help you spot important levels for trade plans like your entry, risk, and exit.
One way is to use the candlestick charts to help you spot exit points before a stock reverses and turns a winner into a loser. You can learn that lesson here.
But I also like to use it to spot an entry and risk level. That’s what I’m going to talk about today…
Let me show you you could’ve used it in PXMD yesterday in premarket.
How To Use It In Your Trading
Traders like to oversimplify the dip and rip pattern and just start buying the high of day break in any stock. That’s not how it works…
You need to have the full recipe for a trade — news, chart, volume, low float…
PXMD had all of those things including a premarket press release.
Then it played out exactly what we like to look for in a standard dip and rip — almost in real time as I explained it on my morning webinar.
We look for that initial rush of traders who jump in and buy the press release. Then we wait for the first red five-minute candle.
Then we wait for it to break the high of the big green candle body and we use the low of that red five-minute candle as our risk level.
Here’s what it looked like in PXMD … In this case, you can see that the Oracle support and resistance lines also nailed the key levels.
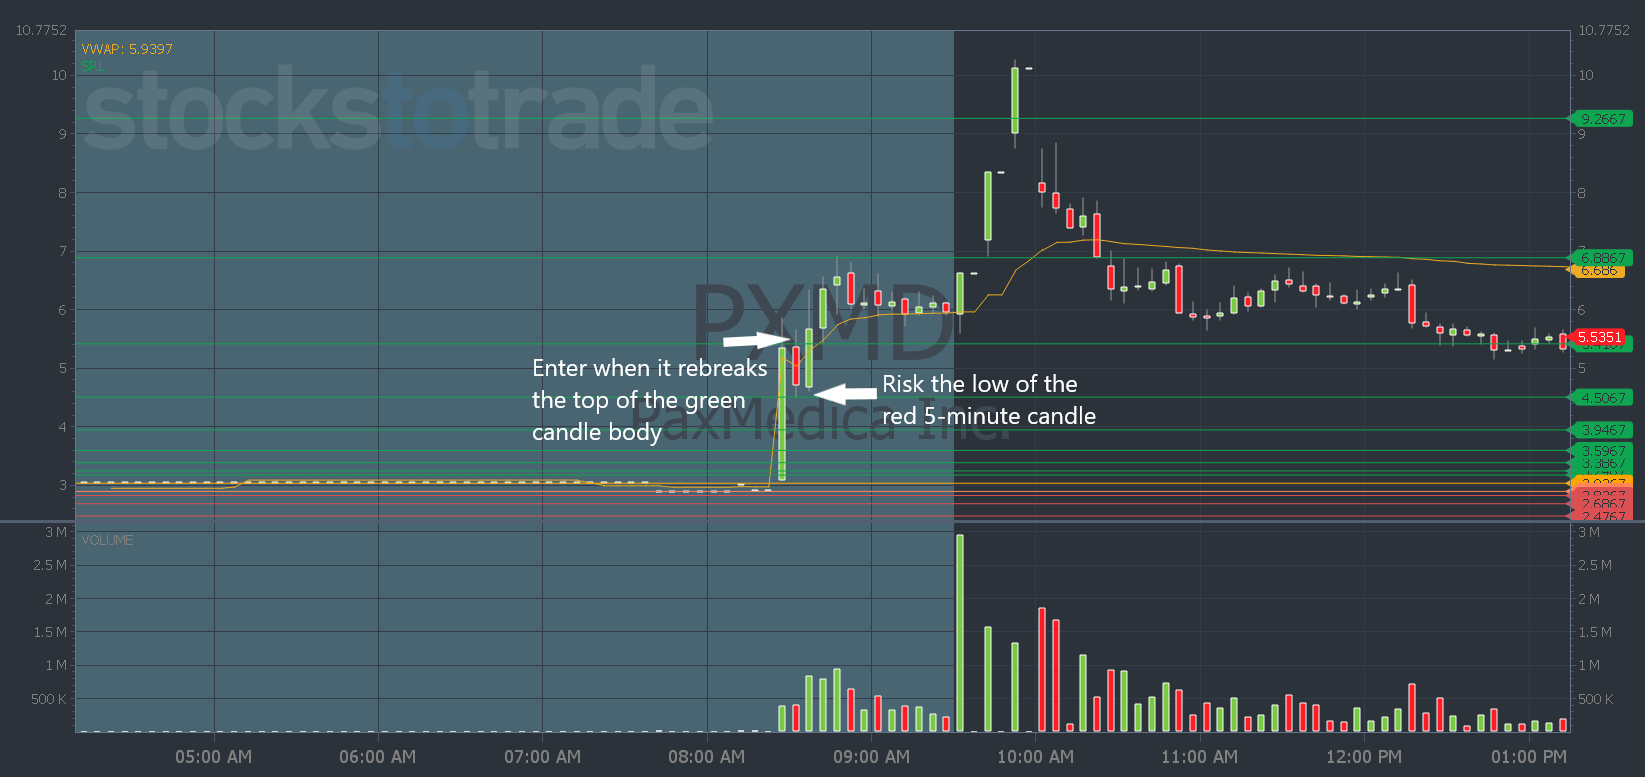
PXMD chart: 1-day, 5-minute candle — courtesy of StocksToTrade.com
The five-minute candle theory can be your secret tool to help you make smart choices, spot entries, and risk levels.
Watch charts til your eyes bleed and record how many examples of this theory you can spot playing out in real time.
And join me for live training sessions where I show the hottest stocks of the day and the plans that played out.
I’ll even show you the tools to help you spot and trade stocks like PXMD all on your own.
These training sessions are completely free — sign up here now!
Have a great day everyone. See you back here tomorrow.
Tim Bohen
Lead Trainer, StocksToTrade