
Trading breakouts is one of the most popular momentum strategies.
However, if you’ve been trading the same way you were, say 1-2 years ago, then you’re probably struggling.
Chalk it up to a number of factors, including the choppy market conditions we’ve had…
You could be getting stopped out and suffering frustrating losses.
The good news is, that Bryce Tuohey shared essential criteria to look for in breakouts in his latest SteadyTrade Team webinar…
And today I’ll show you what criteria can make a stock look like a great potential breakout, but also what key factors might be missing…
When you know what to look for, you can trade confidently and avoid false breakouts going forward.
Ready for my BIG SteadyTrade Team announcement?
See how you can get exclusive access to my daily webinars for a limited time here!
Signs Of A Fake-Out Breakout
On Wednesday afternoon SIGA Technologies, Inc. (NASDAQ: SIGA) looked poised for a breakout over $14.80…
It’s been holding up for weeks without any news. And there’s no reason it should still be up this high — unless it’s full of short sellers.
Those are things we like to see in stocks for a potential short squeeze…
And SIGA broke out over $14.80, but it only moved 20 cents per share before heading lower…
Yesterday it gapped down and failed. What happened?
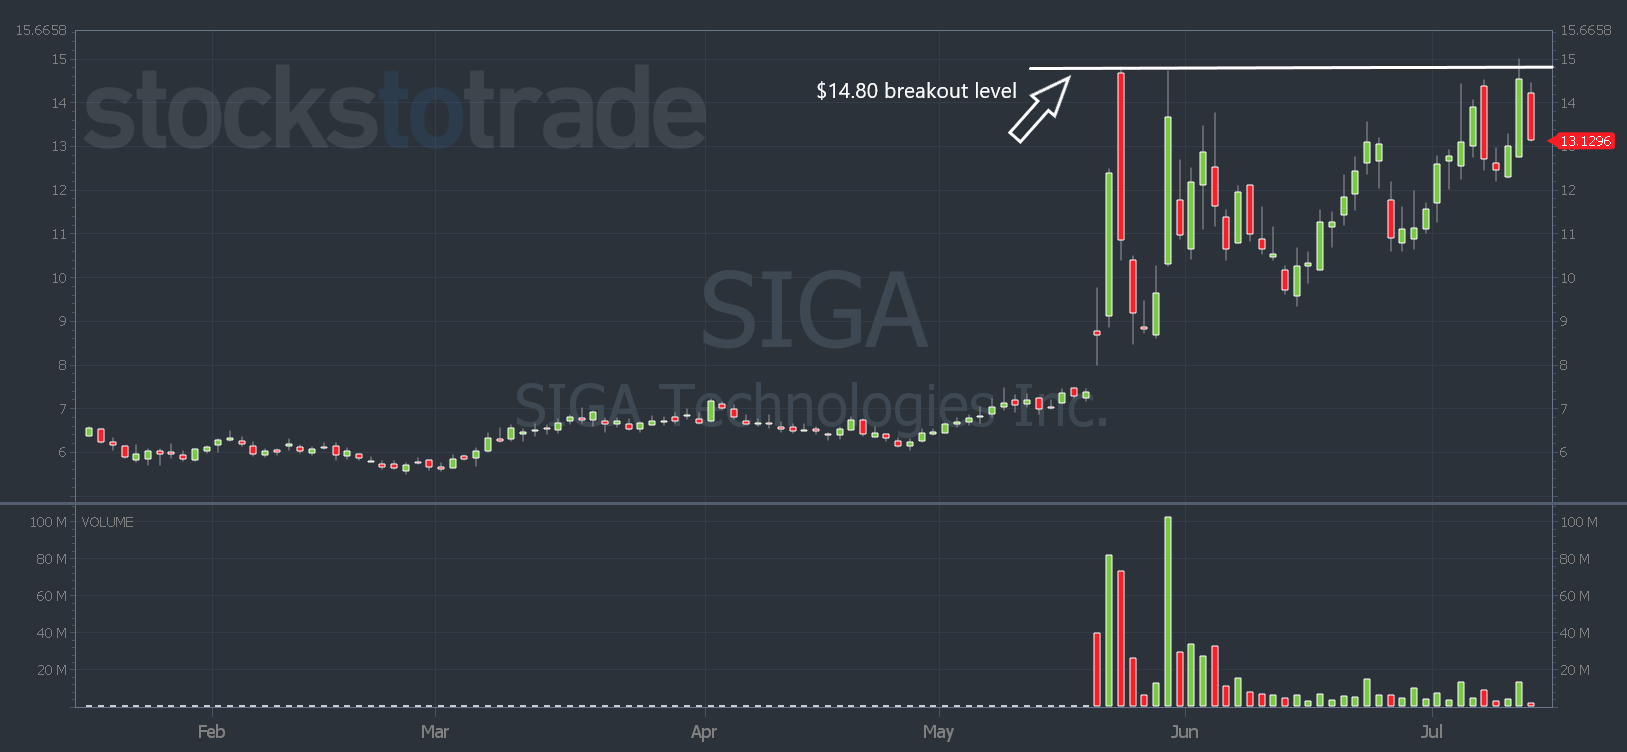
SIGA chart: 6-month, daily candle — courtesy of StocksToTrade.com
In Bryce’s webinar, he explained why SIGA didn’t have an explosive move when it broke above $14.80…
The fact that these criteria were missing, ultimately resulted in SIGA’s failure…
Low Volume
First, SIGA was trading low volume. Look at the daily volume on the chart above. It traded way lower volume than it did on the first few days of its run.
And on the intraday chart below, you can see that when it initially tested the $14.80 breakout level, there was a huge washout candle with high volume.
That can indicate a lot of sellers at the level.
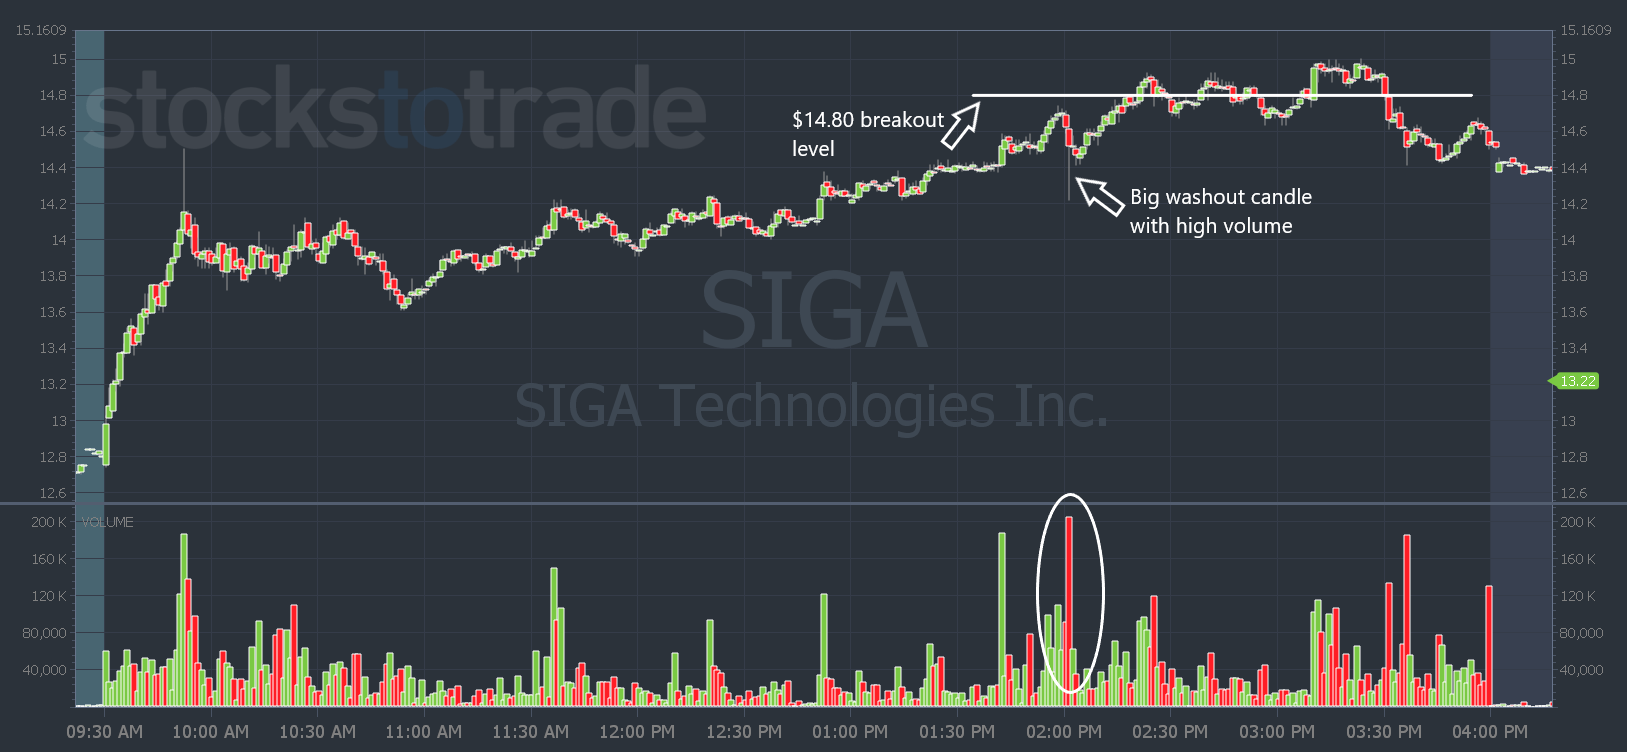
SIGA chart: July 13, 2022, 1-minute candle — courtesy of StocksToTrade.com
So once it broke above $14.80, why didn’t it go higher if it’s full of more short sellers? Two reasons…
Large Float
SIGA has 47 million shares in the float. That means it needs even more volume than a low float stock to have an explosive move.
A large float stock can be full of short sellers … But if they don’t panic and buy to cover, and more buyers don’t come in at a certain level, there’s not enough volume to push it higher.
Remember, SIGA had no news to bring in more buyers…
And when SIGA broke above $14.80 we didn’t see a big volume candle to indicate there are buyers. Next, there was a…
Whole Dollar Level Over Head
Another reason SIGA didn’t continue higher after breaking out was that there was a whole dollar level overhead.
Remember: Short sellers are stubborn.
So while $14.80 was the multi-month breakout level, most shorts probably gave it more room to the whole dollar level of $15.
And that’s exactly where it topped out.
SIGA then failed and closed below the breakout level. If you were still holding and waiting for more upside, that was your sign to exit.
What Was the Best Way to Play SIGA?
As a new trader, you must wait for the safer, higher-odds setups. Especially if you’re under the PDT and can’t re-enter if you’re early and get stopped out.
And Bryce explained that in his webinar…
He said a good entry for new traders was to wait for a break above $15. Then watch for consolidation above the breakout level to hold.
Waiting for that entry means you’ll have a wider risk, but if enough shorts are trapped and want to get out, dips will hold and the stock will bounce back.
If you want more tips on how to avoid false breakouts — watch this video.
And don’t miss your chance for exclusive access to the SteadyTrade Team.
It starts on Monday so sign up here now!
Have a great day everyone. I’ll see you back here tomorrow.
Tim Bohen
Lead Trainer, StocksToTrade