
The FedEx Corporation (NYSE: FDX) earnings release tanked the market Friday morning. I can’t sugarcoat it…
It was bad news.
But I’m Mr. Optimism, and even on a red-tape day, you can find a winner if you know where to look.
And since it was Friday, I had high hopes for some squeeze action.
A lot of traders were looking at stocks like IMARA Inc. (NASDAQ: IMRA), HeartBeam, Inc. (NASDAQ: BEAT), and China Liberal Education Holdings Limited (NASDAQ: CLEU).
Heck, even I liked a couple of them in premarket…
But when the market opened and the day went on, they all did nothing.
So as we dive into the new trading week, I’m digging into one of the most essential tools you’ll need to catch your best trades…
A Trader’s Most Essential Tool
The lifeblood of a trader is their watchlist.
After all, a successfully executed trade starts with watching the right stocks.
Most traders start by looking for stocks that are big percent gainers with a catalyst, volume, and volatility. Then they study the chart to determine if the stock is a good long or short and make their trading plan.
But all that can be tough to do if you don’t know what to look for in a good stock to trade…
Or which levels are important to plan your trades.
So while some traders struggle to find the right stocks to watch, especially on slow days like Friday — Oracle always finds the 20 stocks with the most potential for big moves.
And if you’re looking at the right stocks — you can find a green trade in a sea of red…
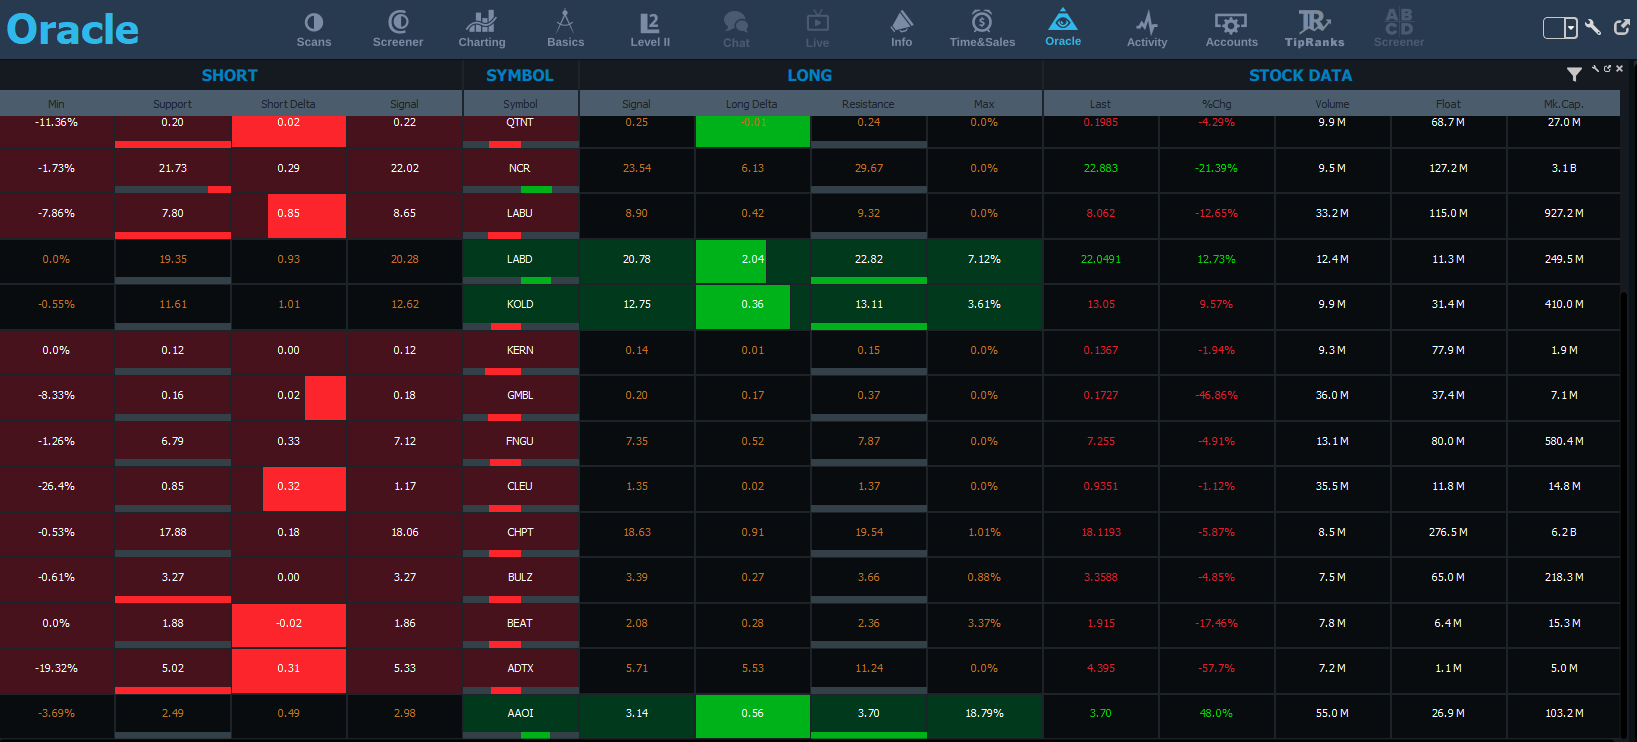
Like on Friday, Oracle spotted Applied Optoelectronics, Inc. (NASDAQ: AAOI)…
Most stocks were showing red signals besides some 3X leveraged ETFs that I recommend traders stay away from.
But AAOI was gapping up on news of an asset sale and a new product launch…
Asset sales aren’t my favorite catalyst. I mean, the company is selling an asset, which I don’t always think is a good thing.
But while all the other premarket gainers were tanking, you can come back to Oracle and see which stocks are moving.
AAOI made a dip-and-rip style move with a break above the high made at the open. Then it held VWAP and continued higher.
When you see a stock make a reversal like that — it should be on your radar.
And if you don’t know how to plan a trade, you can use the Oracle support and resistance levels on the chart to lay out the levels for you…
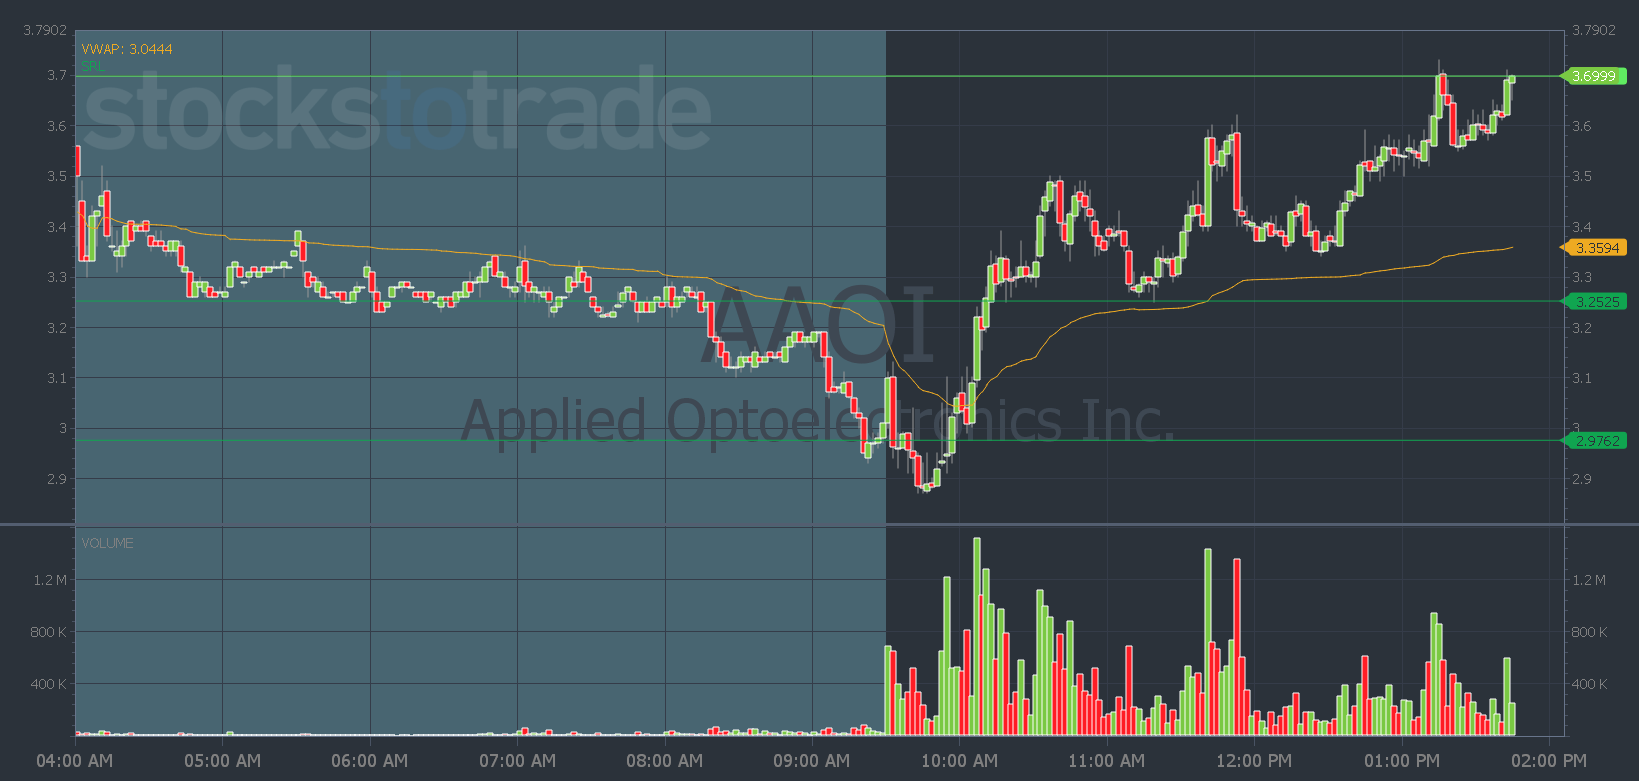
AAOI chart: 1-day, 2-minute candle — courtesy of StocksToTrade.com
Look how nicely it spiked when it was through the $3.25 level. Then it retested that level and resistance became support. And it continued higher to Oracle’s next resistance level.
Later in the day, it broke through that level as well…
But we don’t have to nitpick over pennies.
If you found a green trade with the levels mapped out for you and executed a successful plan while most other traders saw red, you’d probably be pretty happy with that trade, right?
Well, that’s what’s possible when you use Oracle to find stocks to watch and make trade plans.
Check out this walkthrough of how to use Oracle and put it to work for you on this Money Monday.