
The markets got crushed on Friday for the second week in a row. But it’s still my favorite day to trade…
Because while short-sellers are listening to the overall market doom and gloom about GDP contraction and interest rate concerns…
…And shorting any stock that’s up…
Traders in the SteadyTrade Team are busy taking advantage of short squeezes.
But what makes a stock a good short squeeze candidate?
Not every recent runner has the same potential. Want to learn how to spot the difference? Read on…
And get the tech tool that can help you spot entries on epic short squeezes!
An Epic Friday Short Squeeze?
On Friday, a SteadyTrade Team member wanted to know whether T Stamp Inc. (NASDAQ: IDAI) was a good short squeeze candidate.
Here’s why I didn’t like it…
For the ideal short squeeze, I like stocks to pull back from their recent highs. That’s what lures in the short-sellers…
But by premarket on Friday, IDAI was roughly 100% off its highs — that’s a big pullback.
So even though it was still up roughly 100% from Wednesday’s close, all the buying was at higher prices. There are too many bagholders who drank the kool-aid, bought it at $8, and held it…
That means more selling pressure into any spikes. Along with shorts adding to their position. Plus, it had no volume on Friday…
In short, the stock’s dead.
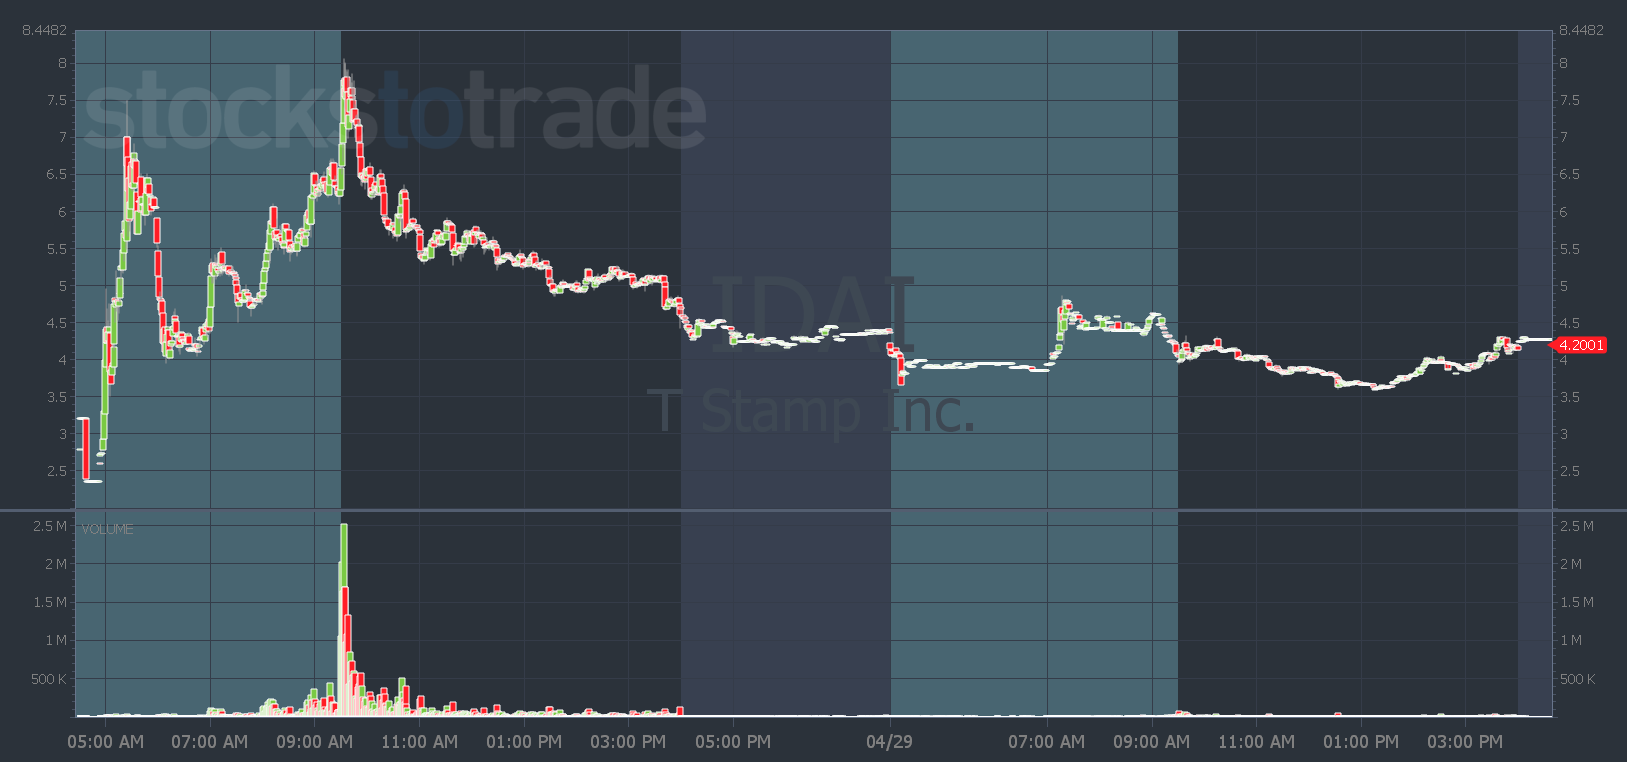
IDAI chart: 2-day, 1-minute candle — courtesy of StocksToTrade.com
Two Better Plays I Outlined on Friday
What I like to see for an ideal short squeeze is a stock like Cyngn Inc. (NASDAQ: CYN).
It’s hanging around and volume is steady — even though the company did an offering last week. And any shorts who shorted the offering news were trapped. Here are my Friday notes…
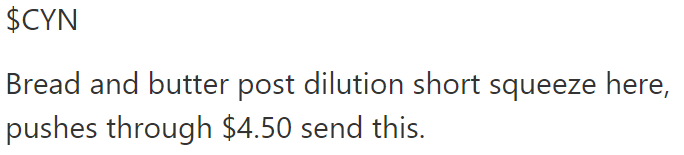
And what do you know? The stock broke out on Friday above $4.50 and squeezed through $5.50.
Check out the chart…
CYN chart: 1-day, 1-minute candle — courtesy of StocksToTrade.com
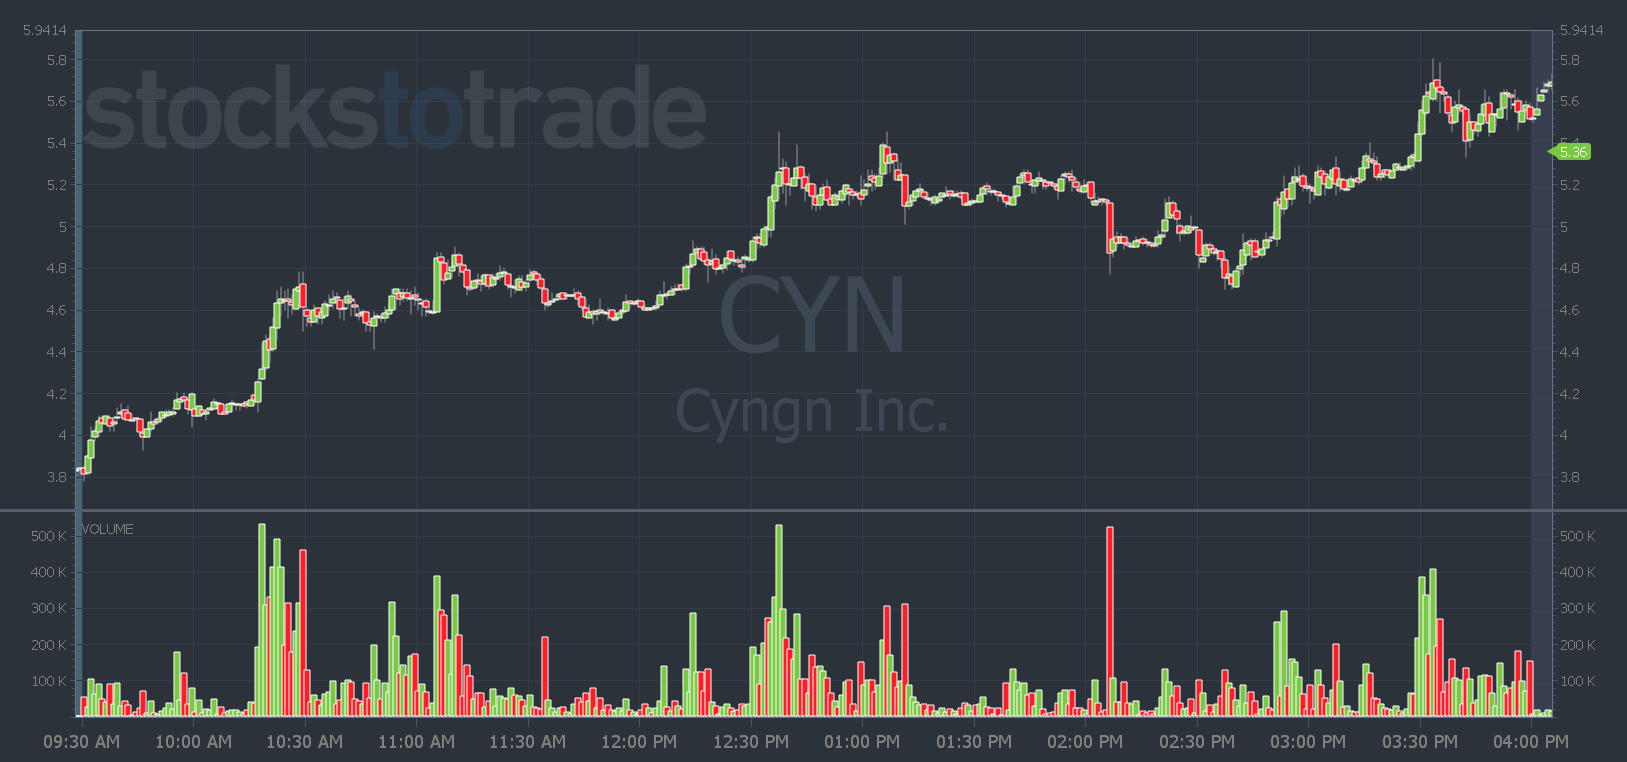
Another great Friday short squeeze idea from Friday’s morning SteadyTrade Team webinar was Redbox Entertainment Inc. (NASDAQ: RDBX).
I said if it can get above $4.50 it’s off to the races…
It was a choppier move than CYN. But it gave you two opportunities to trade the break above $4.50 and catch a $1.50 per share move.
RDBX chart: 2-day, 1-minute candle — courtesy of StocksToTrade.com
Both CYN and RDBX weren’t massively off their highs. And that’s what made them better plays…
So how much do I like to see a stock pullback before considering it for a short squeeze?
I wish I had an exact formula.
But it’s not cut and dried…
Sometimes stocks can pull back. Other times they can just chop sideways, then bust through a key level and squeeze.
I can spot them because I have 15 years of trading experience. So I know what to look for on the chart.
If you don’t have experience and want to increase your learning curve, consider getting a trading mentor. Or use tech tools to help you spot the right entries and exits for a trade.
You don’t have to struggle alone.
Have a great Money Monday. See you all back here tomorrow!
Tim Bohen
Lead Trainer, StocksToTrade