
Stocks don’t go up forever.
And that’s especially true for penny stocks — they all fail eventually.
Our goal is to trade the momentum and patterns on the way up. And be out before the bottom falls out.
So today I’m going to show you how you can recognize when a stock’s in play and when the gig is up and shorts take over.
This is must-know chart recognition — whether you go long or short!
Get the best charts and indicators to help you trade technical levels with StocksToTrade.
Get your special all-inclusive offer here.
Table of Contents
Front Side vs. the Back Side of a Move
As a trader, know your role. Here’s how to know whether you should trade the front or back side of a move…
The Front Side
The front side of a move is what long traders want to trade. We look for stocks that are big percent gainers in premarket with some kind of news catalyst.
Then we want to see that it can continue to make new highs. We want to see lots of volume, higher lows, and higher highs. We want to take advantage of buyers that are willing to get in at any price…
That keeps it moving higher — momentum, frothiness, and FOMO.
But when the party’s over, don’t get caught holding a bag.
The Back Side of a Move
The back side of a move is when shorts take over.
Once a stock has a parabolic spike with massive green candles and high volume, that usually indicates that everyone who wanted to buy the stock, is already in it.
It’s what short-sellers call a blow-off top.
That’s when the last of the last buyers pile into a stock and shorts attack.
And once that happens, volume and demand start to fade. And the price goes down with them. That traps all the longs who chased entries at the top. Which makes the backside of a move a self-fulfilling prophecy…
Because as the price falls, there’s even more selling pressure as longs sell into spikes to get out for break even.
Watch this video to learn more.
Now, let’s look at some chart examples so you can see what a momentum shift looks like…
Chart Examples of Front vs. Back Side
Sidus Space, Inc. (NASDAQ: SIDU) gapped up on June 15 after the company announced a contract with NASA. Pretty big deal, right?
Well, I don’t care so much about the news. I care about price action…
SIDU had a big spike in premarket after the news. Then it sold off and went sideways. But in the afternoon, it started to grind back up…
It made higher lows, then blew through the high of the day and it was off to the races.
On the second day, it had an even bigger premarket spike.
And after the market opened it made another new high. But instead of continuing higher, SIDU chopped sideways and had some pretty hard pullbacks. The volume also faded throughout the day.
See what that meant for SIDU on the chart below…
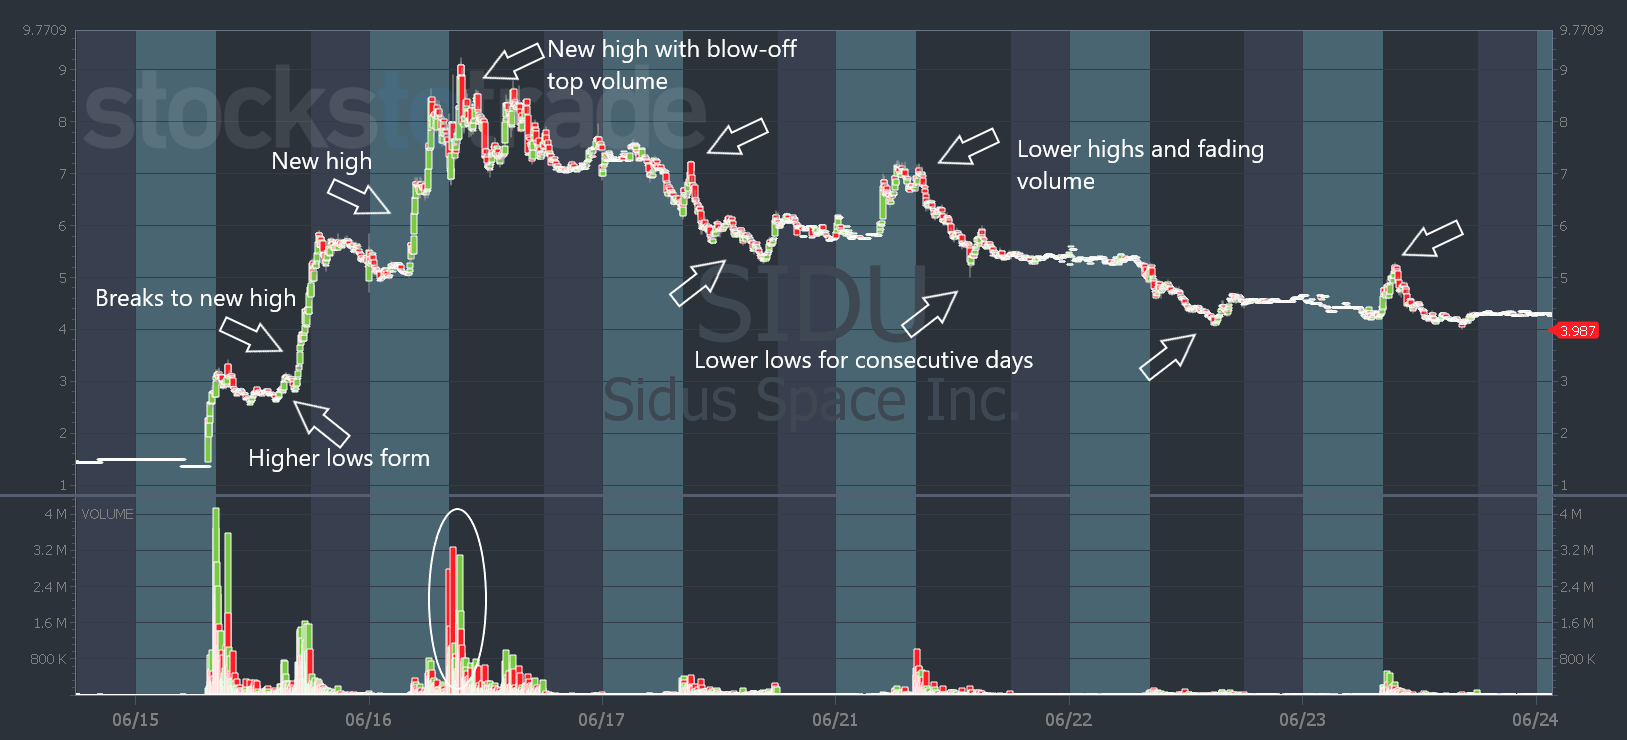
SIDU chart: 6-day, 2-minute candle — courtesy of StocksToTrade.com
The party was over. Volume continued to fade and it made lower highs and lower lows over the next few days.
But not all charts play out as clean as SIDU. Let’s look at another example that’s a little more complex…
AeroClean Technologies, Inc. (NASDAQ: AERC) ran for multiple days, as opposed to SIDU’s two-day run.
That’s because AERC didn’t play out as the shorts expected. They look for clean charts like SIDU’s. AERC had other plans…
You can see on the chart below that AERC had that big parabolic spike after it broke above the first green day’s high. It traded massive volume, and the following day it made a lower high. Shorts thought the move was over…
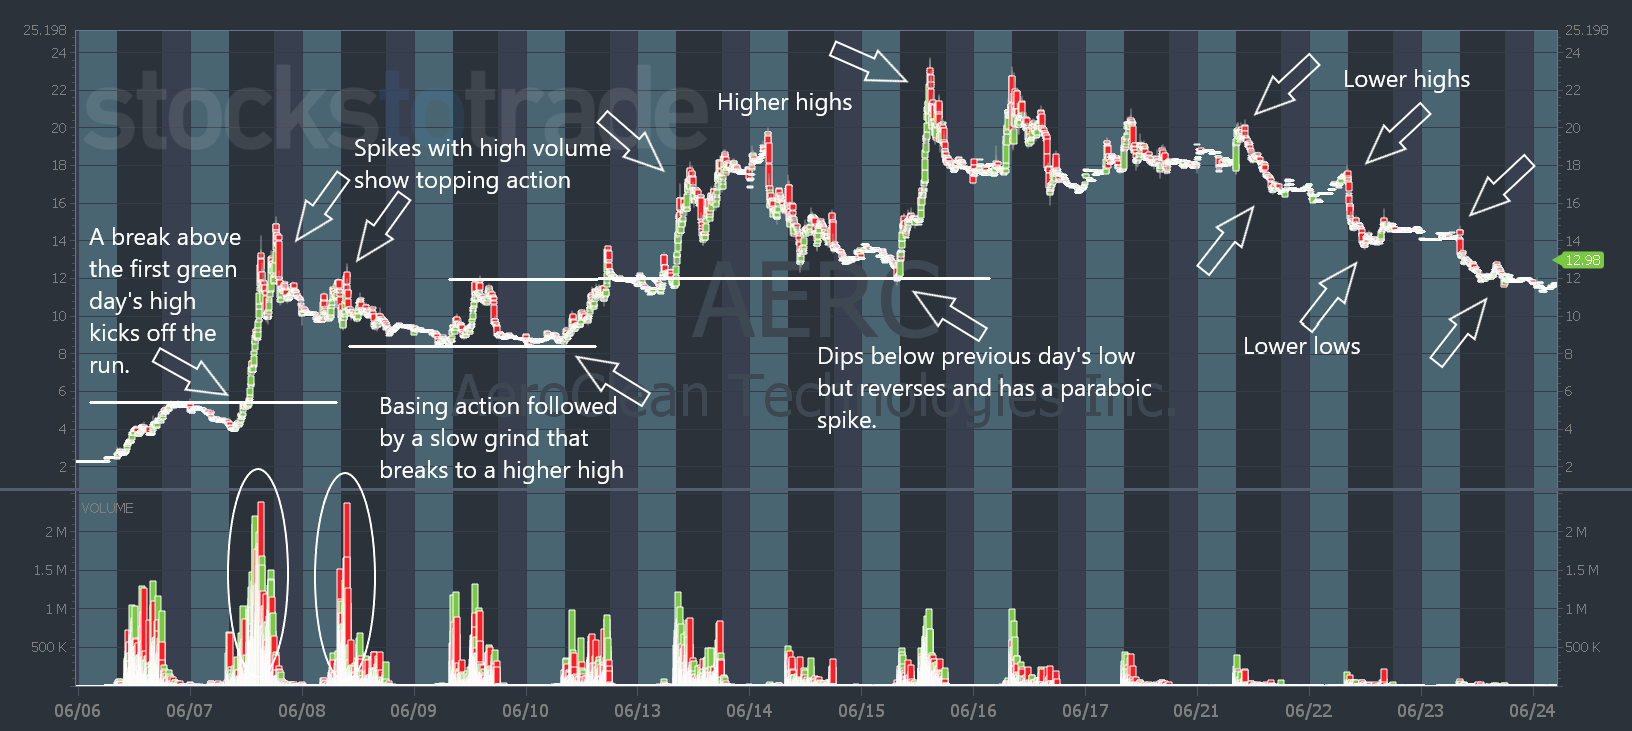
AERC chart: 15-day, 2-minute candle — courtesy of StocksToTrade.com
But instead of making lower lows, AERC formed a base for two days. Shorts started to exit…
And AERC started to grind higher. It made new higher highs and trapped stubborn shorts.
Then on June 15, AERC broke through the previous day’s low. But instead of breaking down, it reversed. That created another parabolic spike to new highs.
When AERC double topped just below $24, volume faded, and we got the back side of the move.
The signs of a front and back side of a move can apply to intraday charts too.
So before you take a trade today, ask yourself: Is this the front side or back side of the move?
It could save you from taking a trade where momentum is against you.
Not every chart will look the same. But as you get more experience with charts and price action, you’ll be able to spot these moves and levels in real time.
If you want the best charting tools and trading indicators — try StocksToTrade with our special offer here.
Have a great Money Monday, everyone. See you back here tomorrow.
Tim Bohen
Lead Trainer, StocksToTrade